

Uncertainty has a price
We’ve all read the headlines: elections, tariffs, deficits, global conflict. And as expected, the usual flood of cautionary market commentary has accompanied the news—“uncertainty is rising,” “storm clouds are gathering,” “investors should tread carefully.” You might have expected that this commentary would echo those warnings and advise you to hunker down, avoid risk and brace for volatility.
Instead, I want to pick up where I left off last quarter. This time I admittedly have a bit more hindsight. Since then, markets have rallied and moved counter to the cautionary narratives that often emerge during turbulent times.
In 1Q, I wrote that uncertainty isn’t a temporary condition tied to any one event cycle. It’s a permanent feature of investing. The future is always unknowable. What changes is the market’s perception of how wide the range of outcomes might be. Each new set of information—a policy shift, a geopolitical escalation, a surprise inflation print, a threatening tweet—reshapes that range, and markets respond by repricing risk.
But embedded in last quarter’s message was another idea, which deserves its own spotlight this quarter: uncertainty on its own isn’t inherently good or bad for the long-term value of asset prices. Like valuing a business, a house, or a coupon stream, the importance of uncertainty comes down to price. Our job as investors isn’t just to recognize when uncertainty is rising. It’s to determine whether markets are mispricing that uncertainty. In other words, are investors being paid enough to bear the wider range of potential outcomes? Is the discount sufficient to justify the risk?
April’s market conditions offered a case study of how a chaotic moment can provide opportunities. When investors overestimate uncertainty, they tend to over-discount prices, which in turn creates compelling investment opportunities. For our portfolio in April, these included a domestic cruise line company valued at levels that implied a sharp slowdown despite a well-insulated business model; a primary ABS deal backed by autos with improving credit enhancements; a U.S.-based private jet manufacturer with strong forward visibility; and other issuers that remained insulated from tariff pressures. Identifying compelling opportunities is not about forecasting the future with precision. It’s about evaluating whether prices already reflect the fog.
Uncertainty has a price. And sometimes, it trades at a discount.
Uncertainty isn’t the same as lower expected returns
One of the more persistent misunderstandings in markets is how often uncertainty gets mistaken for lower expected returns. But the two aren’t the same. In our view, expected returns decline if the probability or severity of negative outcomes actually increases. Uncertainty simply means the range of outcomes is wider, though not necessarily worse.
Think of a card game where you draw one card from a deck, and the number on the card is the number of dollars you win. The deck has ten cards.
In version A of the game, the deck contains only three values:
• Four cards with a 4
• Two cards with a 5
• Four cards with a 6
The average (expected) payout is exactly $5.
Now in version B, the deck is reshuffled. It still has ten cards, and the average payout is still $5. This time, however, the cards include a much wider range:
• One card with a 1
• One with a 2
• One with a 3
• One with a 4
• One with a 5
• One with a 6
• One with a 7
• One with an 8
• One with a 9
• One with a 10
The expected value is still $5. But the outcomes now range from $1 to $10 instead of hovering near the middle. The variance has increased, but not the average. That’s uncertainty: the expected outcome hasn’t changed, but the possible outcomes to get there have become more extreme to the negative and positive.
Uncertainty really means a wider range of outcomes, not necessarily a worse outcome. And when prices fall based on that perspective alone, new prospects can emerge, especially if the expected outcome is unchanged.
Simply put, the easy part of investing is pointing out that uncertainty is rising or that the range of outcomes is widening. In fact, that’s the kind of pattern-spotting that artificial intelligence might someday be great at. The harder—and far more human—part is figuring out whether you’re being compensated appropriately for those wider ranges. That’s where the art of investing lives, and that’s where our job security from AI comes in. (Take that, ChatGPT!)
This isn’t just a theory. The past quarter offers evidence of how an overreaction to uncertainty can cause a mispricing of securities. Markets were hit with a wave of macro concerns: tariffs, war escalation, fiscal deterioration. Although all of these issues were real, they weren’t unknowable, and they were increasingly reflected in asset prices. In many cases, we believe asset prices were likely over-discounted as a result of these issues. Credit spreads widened sharply in April, even for issuers whose fundamentals hadn’t changed. The uncertainty was real. But the market’s reaction? We felt it was excessive in specific cases.
We added 12 percentage points of credit risk during that period. That’s not because the world looked any clearer. Rather, the market was offering better compensation for the same underlying risks. We weren’t buying certainty. We were buying mispriced probability.
The behavioral cost of avoiding uncertainty
In fixed income investing, it’s easy to focus solely on what could go wrong. That makes sense because bond outcomes are negatively asymmetric. If something breaks, investors can lose some or all of their investment. If everything goes right, investors collect their coupon and recover their principal. So, investors tend to err on the side of caution. But that same impulse can lead to missed opportunities when spreads widen, prices fall, and expected returns rise.
Historically, we have seen that as spreads widen and prices fall, fundamental prospects must deteriorate in proportion just to keep expected value flat. If they don’t, expected returns rise. That’s not theory; it’s bond math.
This is where dislocation happens. Our behavioral bias to fear losses more than we value gains keeps many investors on the sidelines even as the odds improve. My colleague, and our CIO – U.S. Bill Nygren discusses this often on the equity side: historically, investors who stay fully invested through periods of fear and volatility tend to outperform those who attempt to de-risk at the wrong moments. Motion might feel prudent, but often, it’s just a drag on performance.
This applies to credit, too. Investors are often penalized more for missing the recovery than enduring the drawdown. That’s a hidden—and rarely acknowledged—cost of uncertainty.
Since COVID, every time high yield spreads have moved above 450 basis points, forward 12-month returns have meaningfully exceeded long-term averages. But in those moments, fear has been louder than facts. The opportunity didn’t feel like an opportunity. It felt like something to avoid. Staying invested is just as important in fixed income—if not more so—because of its unique structure: coupons and maturities are fixed, so when prices fall, yields mathematically rise, increasing your return as long as there’s no default or restructuring.
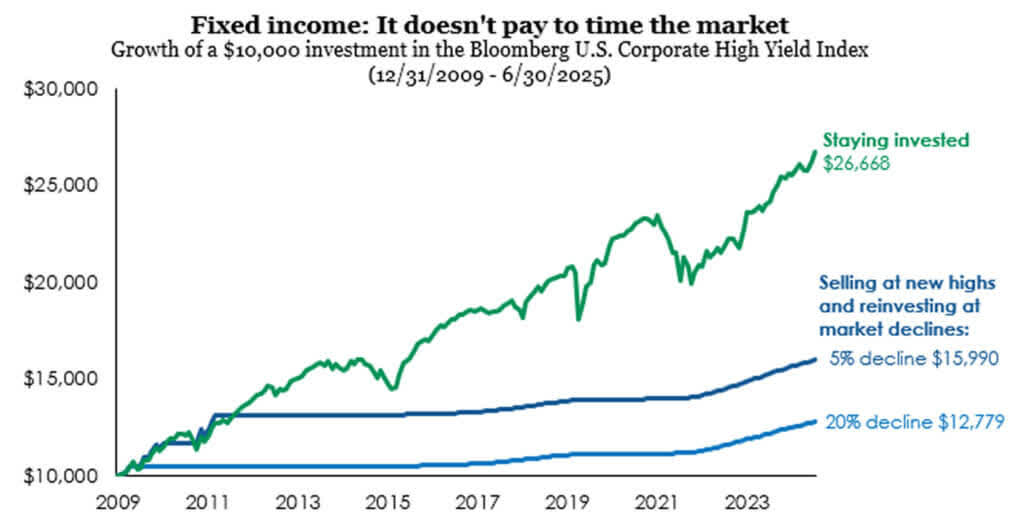
Selling at new highs and reinvesting at market declines assumes an investment in the Index, a move to cash when a new all-time high price is reached (earning a return estimated by the ICE BAML 3-month T-Bill) and reinvestment when the market declines 5% or 20% from that high. Past performance is no guarantee of future results. Current performance may be lower or higher than the performance data quoted. All returns reflect the reinvestment of dividends and capital gains and the deduction of transaction costs.
The opportunity cost of uncertainty: Yield, time, and execution
To close, let’s dig into the real opportunity cost of trying to time the market in fixed income. Credit spreads—the extra yield over Treasurys—get a lot of attention, and rightly so. They’re a key valuation tool in credit investing. But spreads alone don’t tell the full story if one is thinking about the cost of trying to market-time this unique asset class. They overlook other critical components that shape return potential: all-in yield, the cost of time, and real-world execution.
Take April 8th, for example. One could buy the average high yield bond at 4.60% over a 5-year Treasury at 4.1%, for a combined yield of 8.7%. Roughly six months earlier, at the end of the third-quarter 2024, that same rated bond offered a spread of 3.43% over a 3.55% base rate—for an all-in yield around 7.0%. Waiting until April generated 1.7% of additional annualized return. Meanwhile, the cost of sitting in cash fell by 0.5%, so the total opportunity cost, assuming some equivalent amount of risk to being safe in cash, totaled 2.2% annually. So, let’s use our private jet company to calculate the amount of increased default risk we would need to break even if we were paid a surplus of 2.2% each of the next 8 years we own it. The math is below:
Private jet company we invested in 2Q:Given:• Spread increase = 2.2% per year• Recovery rate = 40%• Bond maturity = 8 years
Step-by-step:1. Estimate annual default probability (approximation):We use the formula:

2. Estimate cumulative 8-year default probability: Assuming a constant default hazard rate:

To view this as a losing investment, one would need to believe that fiscal deficits, tariff threats, and wars would make that company 25% more likely to default over the next 8 years. Keep in mind that this is a company with a solid free cash flow profile, a strong backlog of demand, and, in our view, very reliable insulation from the direct effects of tariffs. So, is uncertainty priced correctly here?
The extra yield buys more than just higher expected returns. It also buys a measure of potential resilience against future losses. With an 8.67% starting yield and a 6.5 year of duration, default probabilities would need to move to 119% cumulative over the duration of the bond, which is mathematically impossible.
We run breakeven math exactly like these scenarios every day. We are always asking how much spreads would need to move or how many defaults would need to occur for a portfolio to lose money, to lose excess returns versus cash and Treasurys, and relative to other available investments across our universe of asset classes. If the answer is “a lot more than our fundamental expectations over our three-to-five-year time horizon” and the compensation is high, we don’t wait for certainty. We get to work.
Conclusion
Uncertainty isn’t going anywhere. It’s a permanent feature of investing, not a passing storm. Our job is to determine when it’s mispriced—when fear has driven asset prices well below what fundamentals would justify.
This quarter, we’ve shown how uncertainty doesn’t equate to a lower future value of our investments, how behavioral responses can become a source of performance drag, and how yield, time and execution shape the real opportunity set in credit markets.
Observing uncertainty is easy. Pricing it is hard. Acting when others don’t is harder still. But that’s how long-term returns are built.
Uncertainty has a cost. But it also has a price. And for those willing to do the work, that price can offer real opportunity, not just risk. It may not be as popular today to write about, but we believe it’s the message that matters most.
Adam D. Abbas
Portfolio Manager
|
OPINION PIECE. PLEASE SEE ENDNOTES FOR IMPORTANT DISCLOSURES. Important Disclosures The information, data, analyses, and opinions presented herein (including current investment themes, the portfolio managers’ research and investment process, and portfolio characteristics) are for informational purposes only and represent the investments and views of the portfolio managers and Harris Associates L.P. as of the date written and are subject to change and may change based on market and other conditions and without notice. This content is not a recommendation of or an offer to buy or sell a security and is not warranted to be correct, complete or accurate. Certain comments herein are based on current expectations and are considered “forward-looking statements.” These forward looking statements reflect assumptions and analyses made by the portfolio managers and Harris Associates L.P. based on their experience and perception of historical trends, current conditions, expected future developments, and other factors they believe are relevant. Actual future results are subject to a number of investment and other risks and may prove to be different from expectations. Readers are cautioned not to place undue reliance on the forward-looking statements. This material is not intended to be a recommendation or investment advice, does not constitute a solicitation to buy, sell or hold a security or an investment strategy, and is not provided in a fiduciary capacity. The information provided does not take into account the specific objectives or circumstances of any particular investor, or suggest any specific course of action. Investment decisions should be made based on an investor’s objectives and circumstances and in consultation with his or her financial professionals. Yield is the annual rate of return of an investment paid in dividends or interest, expressed as a percentage. A snapshot of a fund’s interest and dividend income, yield is expressed as a percentage of a fund’s net asset value, is based on income earned over a certain time period and is annualized, or projected, for the coming year. The S&P 500 Index is a float-adjusted, capitalization-weighted index of 500 U.S. large-capitalization stocks representing all major industries. It is a widely recognized index of broad, U.S. equity market performance. Returns reflect the reinvestment of dividends. This index is unmanaged and investors cannot invest directly in this index. The Bloomberg U.S. Corporate High Yield Bond Index measures the USD-denominated, high yield, fixed-rate corporate bond market. Securities are classified as high yield if the middle rating of Moody’s, Fitch and S&P is Ba1/BB+/BB+ or below. Bonds from issuers with an emerging markets country of risk, based on Bloomberg EM country definition, are excluded. The Oakmark Equity and Income Fund invests in medium- and lower-quality debt securities that have higher yield potential but present greater investment and credit risk than higher-quality securities. These risks may result in greater share price volatility. An economic downturn could severely disrupt the market in medium or lower grade debt securities and adversely affect the value of outstanding bonds and the ability of the issuers to repay principal and interest. The Oakmark Equity and Income Fund’s portfolio tends to be invested in a relatively small number of securities. As a result, the appreciation or depreciation of any one security held by the Fund will have a greater impact on the Fund’s net asset value than it would if the Fund invested in a larger number of securities. Although that strategy has the potential to generate attractive returns over time, it also increases the Fund’s volatility. Oakmark Equity and Income Fund: The securities of medium-sized companies tend to be more volatile than those of large companies and have underperformed the securities of small and large companies during some periods. The Oakmark Bond Fund invests primarily in a diversified portfolio of bonds and other fixed-income securities. These include, but are not limited to, investment grade corporate bonds; U.S. or non-U.S.-government and government-related obligations (such as, U.S. Treasury securities); below investment-grade corporate bonds; agency mortgage backed-securities; commercial mortgage- and asset-backed securities; senior loans (such as, leveraged loans, bank loans, covenant lite loans, and/or floating rate loans); assignments; restricted securities (e.g., Rule 144A securities); and other fixed and floating rate instruments. The Fund may invest up to 20% of its assets in equity securities, such as common stocks and preferred stocks. The Fund may also hold cash or short-term debt securities from time to time and for temporary defensive purposes. Under normal market conditions, the Fund invests at least 25% of its assets in investment-grade fixed-income securities and may invest up to 35% of its assets in below investment-grade fixed-income securities (commonly known as “high-yield” or “junk bonds”). Fixed income risks include interest-rate and credit risk. Typically, when interest rates rise, there is a corresponding decline in bond values. Credit risk refers to the possibility that the bond issuer will not be able to make principal and interest payments. All information provided is as of 06/30/2025 unless otherwise specified. |
Original Post
Editor’s Note: The summary bullets for this article were chosen by Seeking Alpha editors.
Read the full article here