


Investment thesis
To avoid any misunderstandings – I own a certain position in Procter & Gamble (NYSE:PG), and I don’t intend to sell it. It’s an amazing business with a shareholder-friendly approach. I highly appreciate the dividends that grew over the years and don’t see any “sell” rationale.
Considering PG’s:
- headwinds limiting (to some degree) its growth
- its improved yet below competitors’ level organic volume growth
- its ability to uphold positive growth
- outstanding profitability
- leadership position within numerous market segments across a well-diversified portfolio
I believe that PG has a well-deserved valuation. I will gladly hold on to my shares in PG. However, as each investor’s capital is limited, I will allocate the dividends and additional resources to more attractive risk-to-reward ratio opportunities. I intend to add more PG shares to my portfolio depending on the instance, but for now, that is a patient “hold” for me.
Introduction
PG has a leading personal / home-care portfolio, which includes globally recognizable brands, as PG’s products are present in ~180 countries, with over 50% of the sales generated outside the US. The Company distinguishes five core business segments:
- Beauty – PG has a nearly 20% market share (globally) in the hair care market and owns leading facial skincare brands, such as Olay with a ~5% market share
- Grooming – PG’s grooming brands’ market share exceeds 60% globally while its male electric shavers and female epilators stand for nearly 25% and 50% of the market, respectively
- Health Care – PG competes in oral care and personal health care. Its oral care segment holds nearly 20% global market share.
- Fabric & Home Care – this segment is quite versatile. PG holds ~25% of the global home care market.
- Baby, Feminine & Family Care – PG’s baby care, feminine care and family care segments hold ~20% of the global market, ~25% of the global market, and 65% of the North American market, respectively.
As of the fiscal Q3 2024, the Fabric & Home Care segment generated the highest revenue share, equal to 35%. Sales derived from the Baby, Feminine & Family Care segment amounted to 24%, and the Beauty segment closed the podium with a 14% share in total sales. For details, please review the chart below.
PG’s Q3 2024 SEC Filing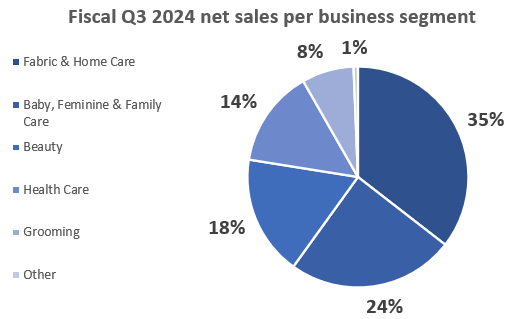
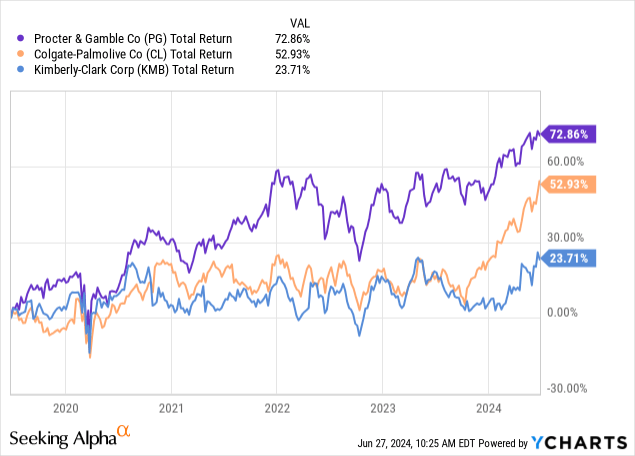
During the last five years, PG has outperformed some of its peers (Colgate-Palmolive (CL) or Kimberly-Clark (KMB)) on a total return basis. The Company’s stock price has recovered well since some significant falls during 2022 and has recently exceeded its previous all-time highs.
Moreover, PG proved to be an excellent choice for income-oriented investors, given its Dividend King status and impressive DPS growth.
PG’s FY 2023 SEC Filing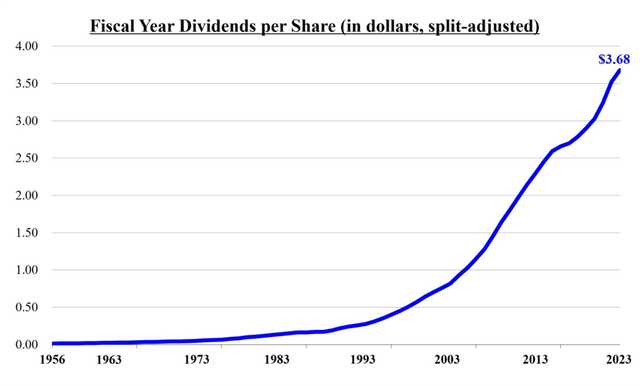
Is the Company overvalued? Is it still an attractive investment opportunity? Or maybe, as I initially indicated, it’s a pleasing business to hold on to, but there are more attractive capital allocation opportunities out there. Let’s discuss – enjoy the read!
Business Performance
Looking at the current fiscal year, Q1-Q3 2024 (July 2023 – March 2024 in calendar terms), the Company managed to grow its total net sales by 3% when compared to the same period of the previous fiscal year. At a big-picture level, this growth was a derivative of three effects:
- a negative foreign exchange effect – (1%)
- a positive price effect – 5%
- a negative effect of the investment activity sales mix impact and rounding reconciliations – (1%)
For details, please review the chart below (positive effects marked in green, negative effects marked in red, and total effect marked in blue).
PG’s Q3 2024 SEC Filing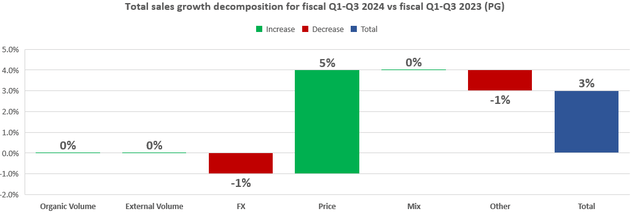
Let’s break the above analysis down into each core business segment, starting with the most significant one – Fabric and Home Care. This segment brought a positive organic volume effect of 1%, which was offset by external volume factors – divestitures (1%). Foreign exchange fluctuations took another 1 percent out of the net sales growth. The Company delivered a 4% growth in this segment due to its pricing power. After considering the positive mix/other effects totalling 2%, the net sales of the Fabric and Home Care segment grew by 5%. Given the highest share of this segment in PG’s revenue, its 5% net sales growth heavily impacted the total net sales growth.
PG’s Q3 2024 SEC Filing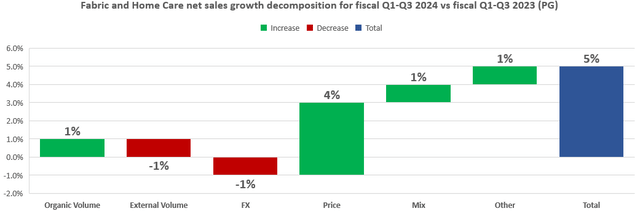
Looking at the other two leading segments – Baby, Feminine & Family Care, and Beauty – they made the least positive contribution to total net sales growth, growing by 1% and 2%, respectively. The growth of the former segment has been limited by (3%) negative organic volume effect combined with (2%) negative FX effect, while the latter faced negative FX and mix effects ((2%) each). For details, please review the charts below.
PG’s Q3 2024 SEC Filing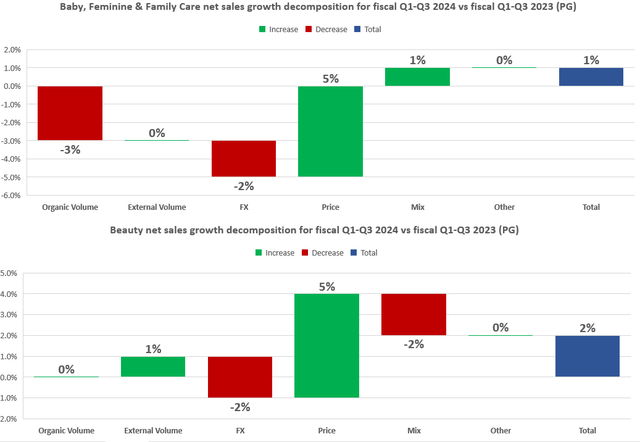
Health Care was the only segment that saw a positive growth impact from foreign exchange fluctuations. Regarding the pricing power, its effect on growth was in line with previously described segments. PG held the most noticeable pricing power with the least significant business segment – Grooming. However, it was offset by the most noticeable (across all business segments) negative FX effect. These segments brought a net sales growth of 6% and 5%, respectively.
PG’s Q3 2024 SEC Filing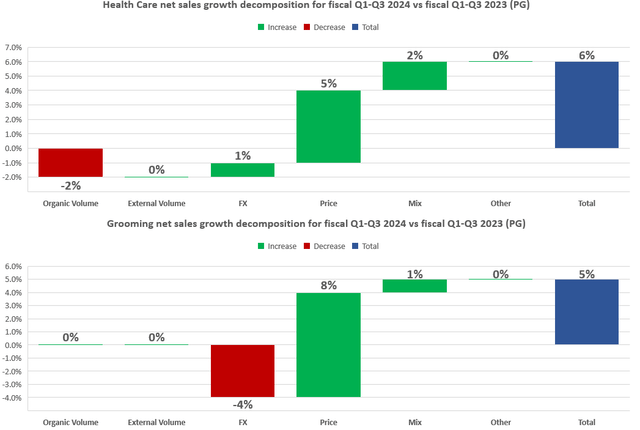
How do the above results stand in the light of FY 2023? While some investors are concerned about the decline in PG’s pricing power (in 2023, the pricing effect contributed 9% to the overall net sales growth vs 5% during the last three quarters), I am glad that the organic volume improved. Although it didn’t show a positive contribution to the fiscal Q1-Q3 2024 net sales growth, it was stable – unlike during 2023, which brought a negative (3%) organic volume effect. For details, please review the table below.
PG’s FY 2023 SEC Filing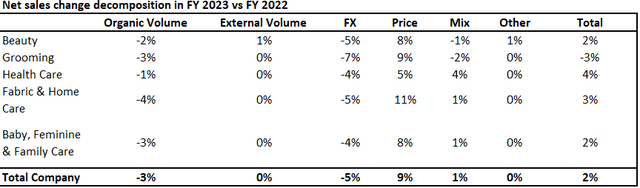
The fiscal Q1 – Q3 2024 period also brought solid net earnings margins within each business segment. While the Beauty segment stayed in line with the FY 2021 – 2023 period, each of the other segments marked the highest net margin in the recent period compared to the FY 2021 – 2023 period. For details, please refer to the chart below.
PG’s SEC Filings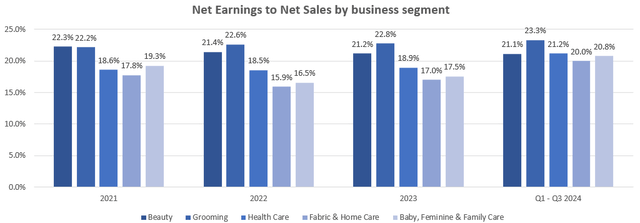
PG’s Recent Results From The Perspective of Its Competitors
There are no perfect comparisons as there are no identical companies, however, I often compare selected business metrics of an analyzed entity to some of its peers/competitors. For this purpose, I’ve selected CL and KMB. To summarize some key differences regarding the January – March 2024 (fiscal Q3 for PG and fiscal Q1 for CL and KMB) vs January – March 2023 net sales growth decomposition:
- CL and KMB delivered organic volume growth, which wasn’t the case for PG
- CL and KMB had more headwinds regarding the foreign exchange fluctuations
- CL and KMB, especially CL, showed stronger pricing power during the recent quarter
As a result, CL managed to grow its net sales by 6.2% when compared to the same period of the previous year, while KMB’s net sales declined by (1%).
PG, CL, and KMB recent SEC filings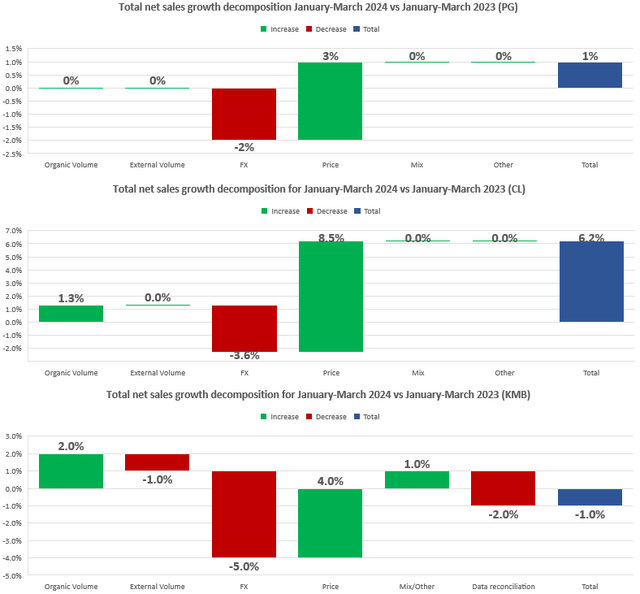
Therefore, there is some room for improvement in terms of the volumes and pricing power. Nevertheless, the Company’s management explained that there are some ongoing issues that negatively impacted its fiscal Q3 2024 metrics. To quote PG’s CFO from the Q3 2024 Earnings Call:
As we noted last quarter, there are some specific issues affecting other markets. Those challenges continue to impact results in the quarter. Greater China organic sales were down 10% versus prior year, progress versus the December quarter, but still impacted by weak underlying market conditions and headwinds for SK-II and other Japanese brands in the market.
SK-II sales in Greater China were down around 30% for the quarter. We have seen some month to month improvement in overall Greater China sales trends, though we expect it will be another quarter or two until we return to growth. Volume trends in some of the European Enterprise and Asia Pacific, Middle East Africa countries such as Egypt, Saudi Arabia, Turkey, Indonesia and Malaysia have remained soft since the start of the heightened tensions in the Middle East.
Also, shipments in Russia continue to decline, double digits given our reduced footprint and curtailed investments with consumers and retailers. Combined, the headwinds from Greater China and Asia, Middle East Africa markets were a 150 basis point impact on total company sales for the quarter. We expect these headwinds to moderate or annualize over the coming periods.
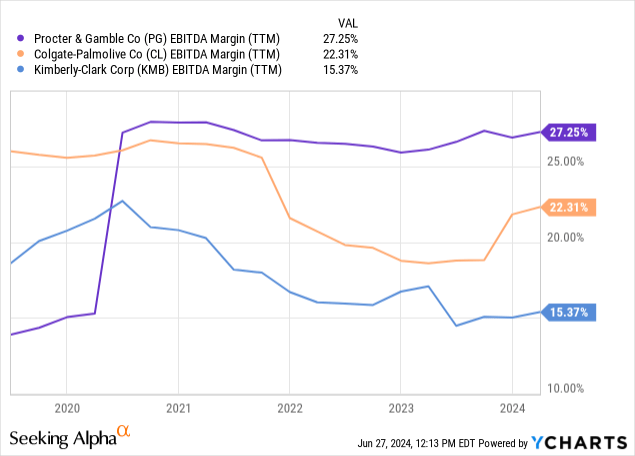
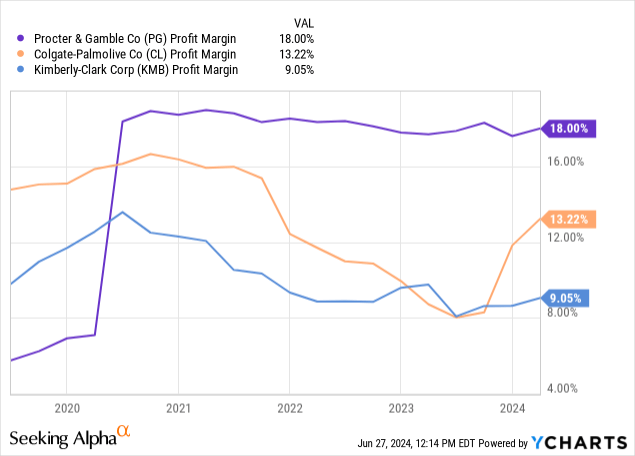
The strength of PG, when compared to the above entities, certainly lies in its profitability. Since mid-2020, the Company has upheld the highest EBITDA and Profit margins, which recently amounted to 27.25% and 18.00%, respectively. These are around 5 percentage points above CL regarding each metric and ~12 percentage points and ~9 percentage points above KMB, respectively.
PG’s Financial Stance
During the fiscal 2019 – 2023 period (with 2018 as a base year), PG delivered a solid diluted EPS CAGR of nearly 10.0% to reach $5.90 in FY 2023. During the fiscal Q1 – Q3 2024 period, PG generated $4.75 diluted EPS, delivering a 4.9% growth on the same period of the previous year.
PG’s earnings announcements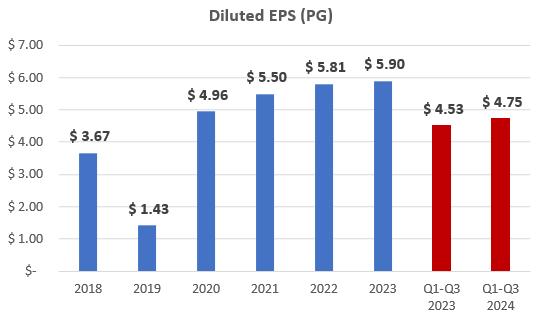
PG’s outstanding business and financial performance have translated into the rewards for its shareholders. The Company delivered 134 years of dividend payments, with 68 years of dividend increases. It has recently announced a quarterly dividend increase equal to 7%. The current dividend yield may not be breathtaking as it stands at a modest forward-looking ~2.4%, but it is:
- well-covered
- growing
- significantly more attractive for PG’s long-time holders who have managed to secure impressive yield on cost by now
PG’s website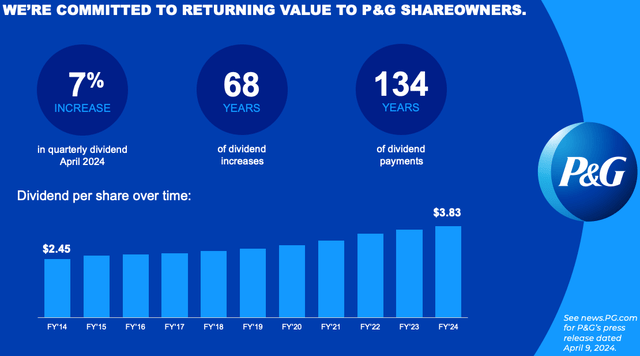
Valuation Outlook and The Bottom Line
As an M&A advisor, I usually rely on a multiple valuation method, which is a leading tool in transaction processes. This method allows for accessible and market-driven benchmarking. Numerous metrics are available for valuing a company, with EV/EBITDA being a rule of thumb for most sectors, especially mature ones. Nevertheless, for transparency – please be aware that this is not a perfectly academic comparison as, for example:
- PG is substantially larger than CL and KMB
- their product portfolios nor market exposures do not align perfectly
Nevertheless, the similarities between these entities are enough for me to provide a reference point. That said, the forward-looking EV/EBITDA stood at:
- 18.3x for PG
- 17.7x for CL
- 13.5x for KMB
Considering PG’s headwinds limiting (to some degree) its growth, its improved yet below competitors’ level organic volume growth, its ability to uphold positive growth, outstanding profitability, and last but certainly not least – a leadership position within numerous market segments across a well-diversified portfolio, I believe that PG’s relatively higher EV/EBITDA multiple compared to CL and KMB is well-deserved.
To put it briefly – I believe that PG is fairly valued and the EV/EBITDA multiple should remain within the 18.0-19.0x range.
Naturally, there are some risk factors to consider, which can vary from business segment to business segment and from market to market. Should PG lose its ability to build volume, raise prices, or address consumer preferences, it could hurt its financial performance and lead to higher stock price volatility. Moreover, investors should keep an eye on the headwinds that limit its growth to some degree (mentioned by PG’s CFO during the last Earnings Call). Nevertheless, I will gladly hold on to my shares in PG. However, as each investor’s capital is limited, I will allocate the dividends and additional resources to more attractive risk-to-reward ratio opportunities. I intend to add more PG shares to my portfolio depending on the instance (regarding business development and valuation), but for now, that is a patient “hold” for me. Thank you!
Read the full article here