

At first blush, the FlexShares Quality Dividend Index Fund ETF (NYSEARCA:QDF) is a vehicle for investors who are on the lookout for sophisticatedly calibrated dividend plays backed by high quality. And as I discussed in my note published on May 11, with QDF, they do get a solidly diversified U.S. equity basket with large exposure to the most profitable companies. Nevertheless, something that I have already addressed is that there are a few peculiarities to tolerate, like the fund’s overreliance on Apple (AAPL) and Microsoft (MSFT), which have had a 9.5% and 5.7% weight, respectively (9.4% and 6.3%, as of November 6). I have nothing against holding these tech bellwethers for dividends or dividend growth, but I believe overweighting them is unnecessary and even harmful for the yield (more on that below), and I would never allocate such a massive share of capital to them in a dividend-oriented portfolio. Partly due to that and also because of QDF’s mixed past performance and a too low yield, I struck a neutral tone.
There are a few reasons why an update is necessary today. First, since the previous note, the index the fund is tracking has been reconstituted twice (in May and August). As a consequence, close to 16% of the May portfolio has been removed, as my calculations show. Second, the ETF has lagged behind the S&P 500 index, even though it did have an exceptionally strong June and July, rising by 6.92% and 4.01%, respectively.
Seeking Alpha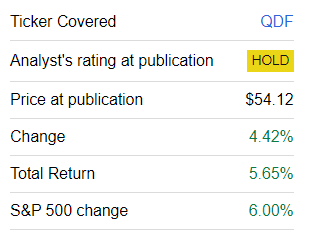
Changes in the equity mix and price fluctuations mean there might be substantial shifts in factor exposures beneath the surface. We need to carefully review it once again to figure out whether the Hold rating should be revised higher or lower.
QDF strategy recap
According to the fund’s website, the basis of its strategy is the Northern Trust Quality Dividend Index, which represents a carefully selected group of dividend-paying constituents of the Northern Trust 1250 Index.
As described in the summary prospectus, constituents “that rank in the lowest quintile of quality based on a proprietary scoring model” are shown the red light. The said model is tripartite, encompassing management efficiency, profitability, and cash flow generation. Then, the optimization process is applied to increase quality exposure, improve the dividend yield of the mix (which should be above the yield of the parent index), and also “achieve the desired beta target.” The index is reconstituted in February, May, August, and November.
The key contributors to and detractors from QDF’s performance
As I have not been tracking the QDF portfolio since May and consequently have no data on exactly when certain holdings were added or removed, I would like to opt for analyzing only the positions that were present in the versions as of May 8 and November 6. This is an approach similar to the one I used in my bullish research note on the SPDR Russell 1000 Yield Focus ETF (ONEY) presented recently. I used prices as of May 10 and November 7.
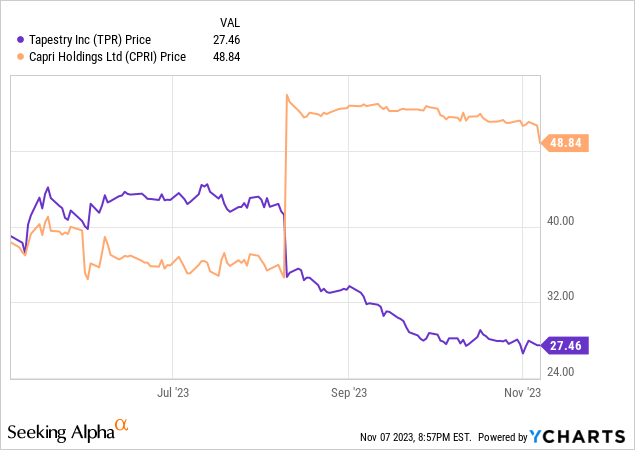
Upon closer look, it seems that despite the fund underperforming the S&P 500, a meaningful share of the holdings that retained their place in the basket was mostly chugging along. For example, while 43 stocks saw their prices declining, with the weakest performance stories being TPR, UGI, BMY, CPT, OLN, and MAA, all with negative returns below 20%, 55 delivered gains, ranging from Illinois Tool Works’ (ITW) a few bps to NVDA’s almost 61%.
| Stock | Weight | Sector | % return |
| Tapestry (TPR) | 0.5% | Consumer Discretionary | -28.3% |
| UGI (UGI) | 0.4% | Utilities | -26.3% |
| Bristol-Myers Squibb Company (BMY) | 0.1% | Health Care | -23.1% |
| Camden Property Trust (CPT) | 0.5% | Real Estate | -21.6% |
| Olin (OLN) | 0.5% | Materials | -20.8% |
Created using data from Seeking Alpha and the fund
| Stock | Weight | Sector | % return |
| Range Resources (RRC) | 0.1% | Energy | 33.2% |
| Sirius XM Holdings (SIRI) | 0.4% | Communication Services | 37.7% |
| Eli Lilly and Company (LLY) | 2.7% | Health Care | 40% |
| Broadcom (AVGO) | 3.2% | Information Technology | 45.2% |
| NVIDIA (NVDA) | 1.2% | Information Technology | 60.8% |
To give a bit more color, one of the key reasons for Tapestry’s painful underperformance was its decision to acquire Capri Holdings (CPRI) announced in early August. While TPR’s price nosedived, CPRI immediately surged, which is typical for M&A.
This nicely illustrates that even highly selective quality-centered equity strategies like the one QDF has cannot completely immunize a portfolio from one-off events that can significantly detract from its performance.
Factor analysis: small EY, somewhat mediocre growth
QDF is still delivering on the quality side, but its value exposure has become even smaller. This does not appeal to me, especially considering a few parameters are outside my comfort range.
| Metric | 6-Nov | 8-May |
| Market Cap | $556.57 billion | $526.76 billion |
| P/S | 5.6 | 5.2 |
| EY | 4.93% | 6.8% |
| Fwd EPS | 5.99% | 5.4% |
| Fwd Revenue | 5.2% | 4.5% |
| ROE | 80.6% | 48.5% |
| ROA | 12.1% | 13.1% |
| Quant Valuation B- or higher | 13.1% | 14.5% |
| Quant Valuation D+ or weaker | 64.9% | 62.4% |
| Quant Profitability B- or higher | 92.8% | 96.1% |
| Quant Profitability D+ or weaker | 2.5% | None |
| 24M beta | 0.99 | 0.95 |
| 60M beta | 1.04 | 1.05 |
Calculated by the author using data from Seeking Alpha and the fund
- QDF’s portfolio of 138 stocks and REITs still cannot offer sizable exposure to the value factor, as the weighted-average market cap has even risen since the previous coverage, with AAPL and MSFT being among the main contributors.
- The earnings yield has retreated to below 5%. However, one of the key culprits is Fidelity National Information Services (FIS), which has been added since May. FIS has an EY of negative 77%.
- The share of holdings with a Quant Valuation grade of B- or better remains too small.
- There are only trace amounts of low-quality stocks in the basket, just 2.5%; however, in May, they were absent completely.
- Capital efficiency is mostly robust, as illustrated by ROA. Alas, ROE is hardly a reliable metric here. One of the problems is that Home Depot (HD) had a negative ROE as of the previous note and was not taken into account. Now, its ROE is 2,065% (its massive debt is to blame), so the portfolio-wise figure is distorted.
QDF’s portfolio has a fairly small weighted average yield of just 2.6%. The fund itself has a 2.27% TTM yield.
Seeking Alpha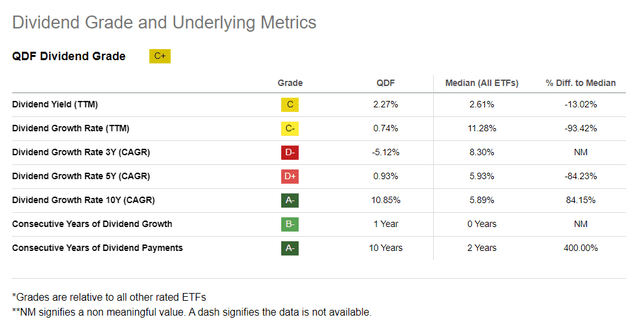
Meanwhile, the double-digit WA dividend CAGRs look rather appealing.
| Yield TTM | Div Growth 3Y | Div Growth 5Y |
| 2.6% | 11.3% | 10.6% |
Calculated by the author using data from Seeking Alpha and the fund
Nevertheless, it is worth remembering that the 3-year figure is heavily influenced by just a few stocks that are shown below. With their impact removed, the CAGR drops to 9.5%.
| Stock | Weight | Div Growth 3Y |
| Cigna (CI) | 0.11% | 393.58% |
| RRC | 0.58% | 151.98% |
| Boyd Gaming (BYD) | 0.07% | 77.28% |
| Warner Music Group (WMG) | 0.52% | 75.62% |
QDF could keep pace neither with IWB nor IVV; drawdown was steeper
Since QDF compares its performance to the Russell 1000 Index, I suppose it would be fair to look at whether it did better than the iShares Russell 1000 ETF (IWB) in the past. For more context, I also added the iShares Core S&P 500 ETF (IVV). The period analyzed is January 2013 – October 2023 (QDF was incepted in December 2012).
| Portfolio | QDF | IVV | IWB |
| Initial Balance | $10,000 | $10,000 | $10,000 |
| Final Balance | $29,295 | $35,964 | $34,869 |
| CAGR | 10.43% | 12.54% | 12.22% |
| Stdev | 14.81% | 14.62% | 14.80% |
| Best Year | 36.29% | 32.30% | 32.78% |
| Worst Year | -12.12% | -18.16% | -19.19% |
| Max. Drawdown | -25.21% | -23.93% | -24.57% |
| Sharpe Ratio | 0.67 | 0.81 | 0.78 |
| Sortino Ratio | 1.02 | 1.26 | 1.21 |
| Market Correlation | 0.97 | 1 | 1 |
Data from Portfolio Visualizer
Unfortunately, QDF delivered the lowest annualized return, the highest standard deviation (though marginally), and the steepest maximum drawdown.
Final thoughts
Is it worth buying into QDF for dividend growth, quality, or low volatility? Or even for all these factors at the same time? Unfortunately, I am struggling to find a sufficient reason to abandon the neutral tone and switch to a more bullish narrative for this ETF. QDF’s dividend yield is low, its value exposure is inadequate, growth characteristics are mediocre, and past performance leaves a lot to be desired, as the ETF does not offer much downside protection.
Read the full article here