


I’ve been steadfastly bullish this year, particularly on tech and growth-oriented stocks. That bullishness has paid off, and we’ve seen an epic rally in growth names this year, led by the tech-heavy Nasdaq. The NASDAQ:QQQ has exploded higher, with only very small pullbacks on the way up. Right now, we’re in the midst of a longer consolidation, and one that has the potential to be a bit more meaningful in terms of declines. However, whether this one morphs into a mid-single digit pullback or not, I think we’re going to end 2023 a lot higher that we are today, even after the huge rally so far this year.
A beautiful chart, but cause for a pause
Let’s start with the daily chart of the QQQ, which shows an extremely powerful uptrend. However, as we head into earnings season, we’re in the midst of a consolidation pattern. Whether this pattern holds and resolves upward, or fails and tests lower support, I still think ultimately we go higher. The question is the short-term path, but I think we’ll get resolution on that fairly quickly.
StockCharts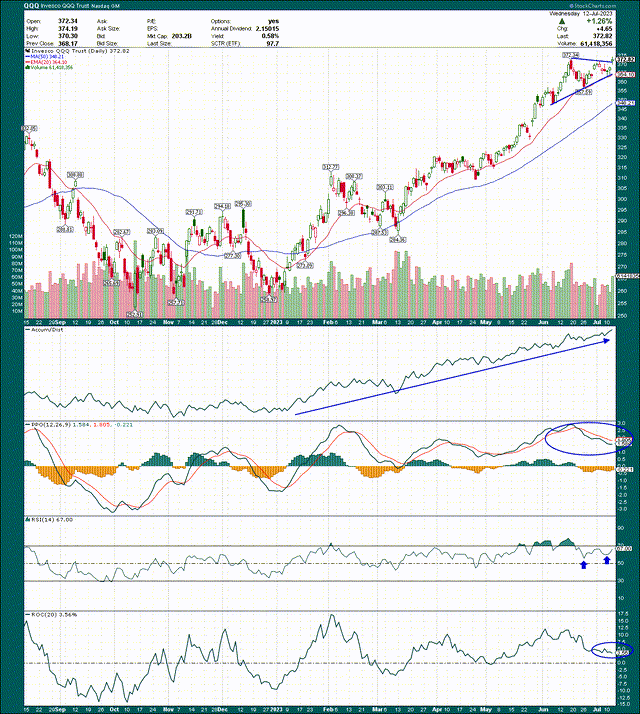
We can see the consolidation pattern in the top right, which I’ve drawn in. The 20-day exponential moving average corresponds to the bottom of the triangle I drew, so that’s the line in the sand for the bulls to start. Below, there’s support at $357, and the rising 50-day simple moving average. I don’t think we see a pullback to the 50-day SMA, but I honestly wish we would; it would be an epic buying chance. Regardless, those are the levels I’m watching, with the 20-day EMA up first, followed by $357.
Now, there’s a mix of bullish and neutral readings here in terms of the indicators. The accumulation/distribution line is flying, which simply means we finish the day higher than the open more often than not. This is a sign of accumulation, and accumulation is only done when Wall Street thinks prices are going higher.
The 14-day RSI is bouncing off of the 60 level, which is a bull market behavior. It means the stock is never getting anywhere close to oversold, implying bullish momentum is unrelenting.
In the bottom panel, the 20-day rate of change is just 4% at the moment. When the ETF has been overbought, it’s 20-day ROC has been in the 10%+ area; we’re nowhere close to that today. Again, this implies there’s ample fuel to the upside for the bulls.
Finally, the PPO is showing a big negative divergence given the ETF continues to rise while the PPO falls. This is generally a sign of at least a consolidation, and at worst, can be a sign of a trend change. In this case, I have a very hard time believing this negative divergence is a trend change given all the other evidence we just looked at. Rather, it looks like the pause that refreshes.
In addition, seasonality is very much in favor of the bulls in the next several weeks.
StockCharts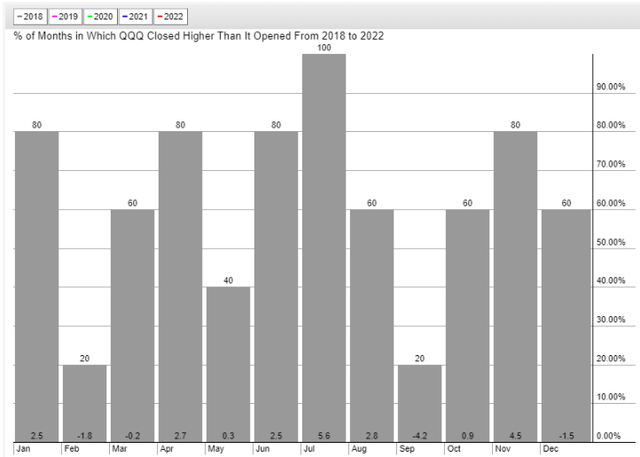
This is the last five years of data, and you can see that all Julys in the past five years have produced higher prices. It gets much less favorable after that, with August at 3 out of 5, and September at just 1. However, for now, we have another 2.5 weeks of very bullish seasonality before it cools off.
Another cause for some caution is sentiment, as measured by the equity put-to-call ratio, or CPCE. Below I’ve charted the 250-day moving average in red, as well as the 5-day moving average in blue. The longer average is a year’s worth of trading, with the shorter one being one week. Both offer useful clues on very different time frames.
StockCharts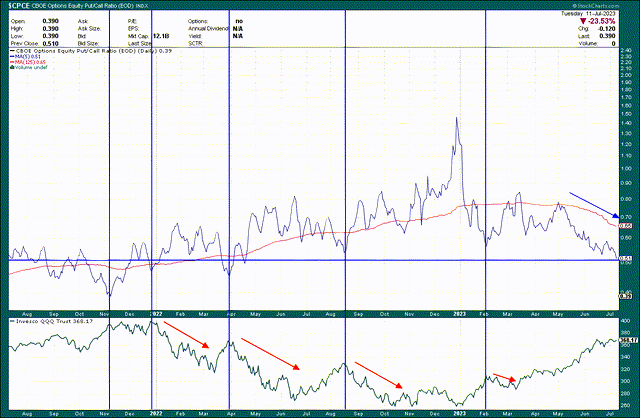
First, the red line of the 250-day moving average has very clearly turned lower off of its uptrend set during the bear market that took hold in 2022. This is a very bullish sign longer-term as that means peak bearishness has passed, meaning there are more equity buyers available.
On the shorter-term, we have a 5-day average of 0.51, which is a very low rating. You can see we had only a handful of ratings in the past couple of years that low, and given this is a contrarian indicator, it’s possible we get a local top in equities. As I mentioned before, any local top would be just that, and not a long-term top.
The past four times the 5-day average was in this same area, which I marked with the vertical blue lines and red downtrend lines in the bottom panel, we did see local tops and some selling. I would not rule out a bit of selling for this reason.
Other considerations
There are a couple of other things going on that do not cause me to waver from my bullishness for this year, but do give me pause in the short-term. One is declining liquidity, which has correlated to equity returns in the past. This does not in any way guarantee it will again, but the relationship here is fairly significant. You can read the context here.
Morgan Stanley via Seeking Alpha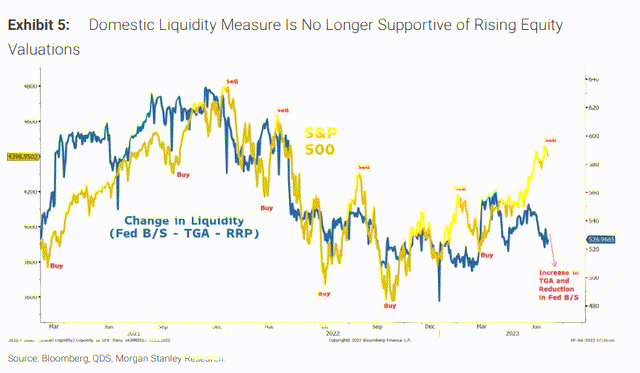
Now, just because there’s a divergence does not mean we’re going to see some massive selloff. We know the debt ceiling nonsense from a few weeks ago distorted this data, but it’s worth watching short-term, and as you can read in the linked article, Morgan Stanley thinks you should position bearishly because of it. I’m not in that camp, but this is a potential risk to the bull case short-term.
One more thing to consider that is specific to the Nasdaq-linked indices is that the Nasdaq-100 is rebalancing due to the overwhelming dominance of the Magnificent Seven in 2023. They’ve reached levels of dominance that don’t fit the rules of the index, and therefore are being artificially rebalanced to lower weights. This is a very infrequent event and has the potential to have unknown consequences. Presumably, any fund that is Nasdaq-linked will have to sell some of the 2023 leaders in favor of names that are being rebalanced with higher weights. Longer-term, I don’t think this changes anything, but again, it’s a short-term speed bump for the index to get through.
The bottom line
If we put all of this together, we have a consolidating chart, very bullish seasonality, and some short-term potential headwinds in the form of overly bullish sentiment, declining liquidity, and an index rebalancing. I’m watching the 20-day EMA, which has thus far held, and $357 below that. As far as I’m concerned, the larger the pullback, the better, as it will provide better buying chances, but irrespective of what this consolidation ends up doing, I’m very bullish QQQ the rest of this year.
Read the full article here