


Investment Summary
In our best estimation, commodities are in another super-cycle, and this is further exemplified by the sector’s performance over the last three months. As shown in Figure 1, the Bloomberg Commodity Index has diverged from the broad stock and bond indices. The divergence has increased as the S&P 500 Index has levelled off after reclaiming its former highs in May.
Figure 1.
Tradingview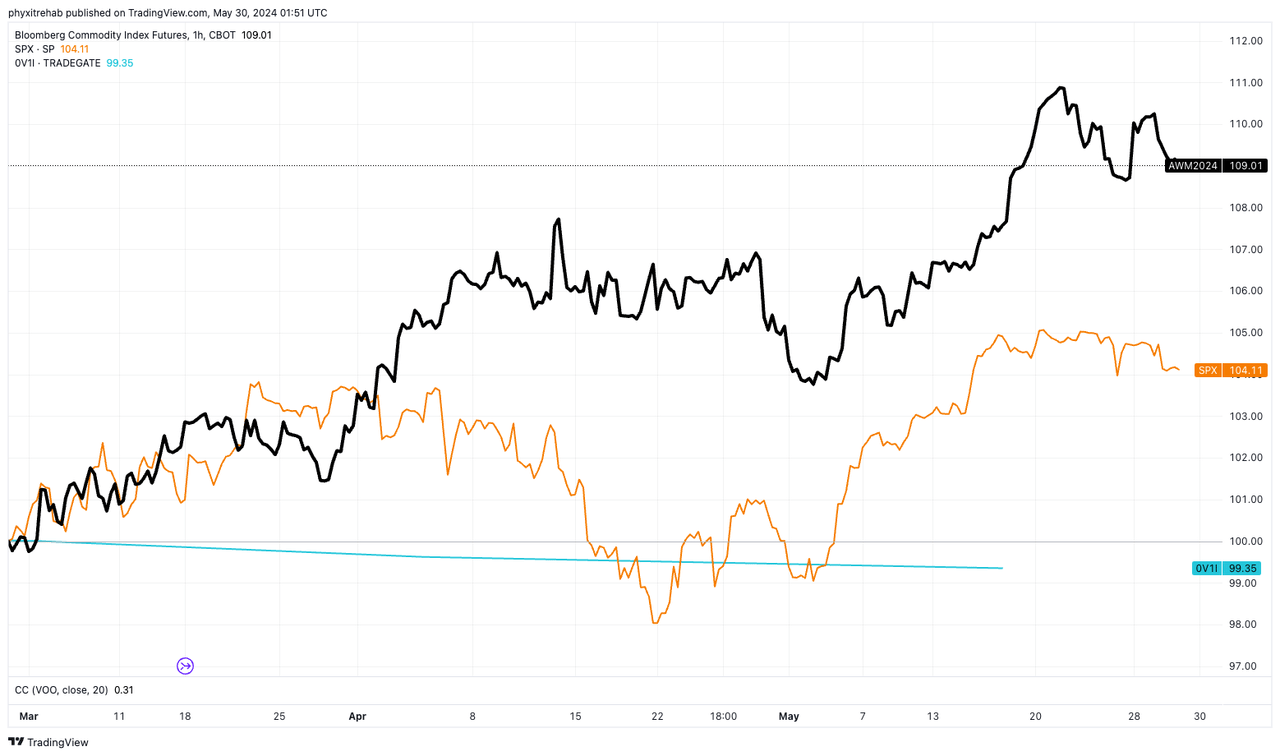
Allocating to the asset class is nuanced, particularly when seeking out equities in the domain. Figure 2 illustrates the performance of various industrial medals—a space that we have become increasingly familiar with in recent years—this year to date. Long steel futures are shown in black, along with copper at the top in orange, and nickel and iron beneath that. Each category has gained value this year.
One of the features that we search for in commodity-type industries is customer penetration. Steel is perhaps the most abundantly used industrial metal outside of copper in electrical applications. It is used in the construction industry, manufacturing industry, medical industry – the list goes on. You cannot store valuable assets in warehousing without steel, simple as that. Steel is used in the construction of just about everything. This is the penetration box ticked for the industry.
The next box that needs ticking is on customer penetration. In that respect, Reliance Steel & Aluminum Co. (NYSE:RS) fits the bill in my view. RS has more than 125,000 customers on its books spanning across a large breath of sub-industry. This is expected, given the abundant acceptance of steel, as I outlined earlier.
Like many in the steel industry, the company’s revenues have been cyclical. This is not unexpected in an industry where potential excess capacity exists, and pricing is determined largely by factors of supply scarcity or constraint. But unlike many in the steel industry, RS‘s top line has grown at a steady clip over the last decade.
In 2014 the company clipped $10.4 billion in sales on operating income of $640 million, and earnings of $371 million ($4.78 per share). This had grown to $11.5 billion by 2018. In 2022 and 2023, respectively, the company put up $17 billion and $14.8 billion in sales, and clipped $1.8 billion and $1.3 billion in net income.
Another point worth noting is that in 2022, around 97% of orders placed with the company were from repeat customers. This is benchmarked against an order fulfilment rate where 40% of customer orders were delivered within 24 hours of purchase.
Figure 2.
Tradingview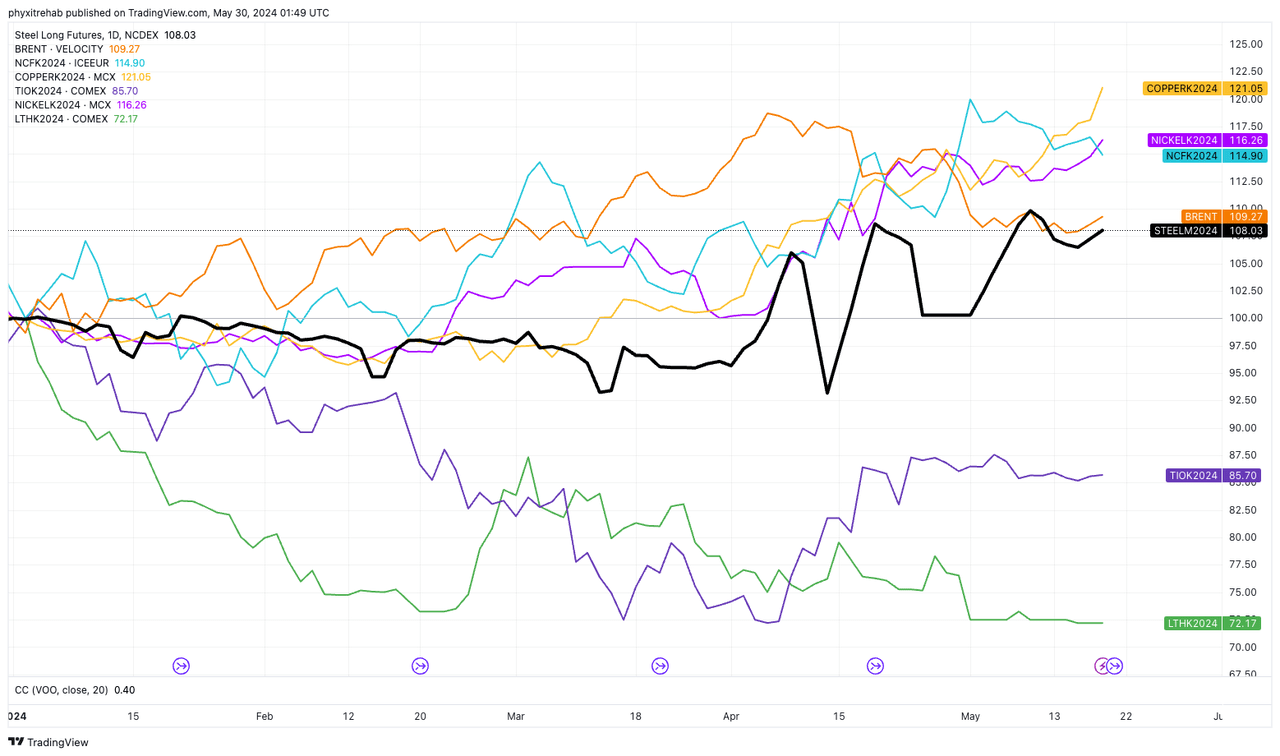
This compounding growth in earnings is not necessarily a usual occurrence in the steel industry. Moreover, given the industry’s competitive economics, where those with production advantages have a leg up, returns on capital are usually average at best.
Here, RS immediately stands out. The industry return on capital is around 7.9%, produced on a free cash flow margin of 4.5%. RS matches the industry in free cash flow margin, although it captures far higher gross profit margins, operating margins and returns on capital (Figure 3).
To me, this suggests it has consumer advantages, as it clips these decent post margins on highly efficient turnover, which I will discuss a little later.
Here, I will outline my investment thesis for RS and explain why I think it is a buy.
Industry outlook
According to the World Steel Association, steel demand is expected to be resilient over the next two years. The major shifting trend is that India is expected to pick up demand pull from China, with growth softening in that region due to declining infrastructure investments and a slowdown in its property sector. The Association projects that India “charges ahead” with 8% compounding growth over the next two years to 2025. This represents an increase of almost 70 million tons over 2020 levels.
If that is the case, consensus projects an average 1–2% top line growth for RS over this time. This would suggest RS would grow in line with the industry and wouldn’t lose any market share. I will explain why this is attractive after running through the company’s latest financials below. Figure 3.
Bloomberg Finance LP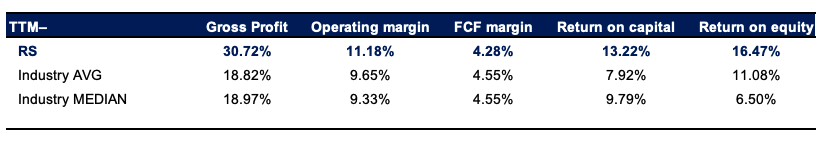
Q1 2024 earnings analysis
One major standard from the Q1 FY’24 was the 80 basis point year-over-year gross profit margin decompression to 31%. I noted the high gross margin versus the industry average earlier. This is a standout, in my opinion. Management has been focused on investing in processing capabilities to lift this gross margin, so to see it eventuate is another tick of approval in my best estimation.
I’d also point out that management has completed three acquisitions so far in 2024, which could potentially add up to $500 million in annualized revenues once fully integrated, per management.
Turning to the quarter, tons sold were up 10.3% sequentially but down 170 basis points year over year, in line with expectations. It realized an average selling price of $2,442 per tonne, also down 100 basis points with the revenue decline.
The company did $3.6 billion worth of business during the quarter, down 8.1% year over a year but up 9.2% sequentially. Moving down the P&L, similar declines were observed, with gross and operating income down to $1.1 billion and $396 million, respectively. Quarterly capital expenditures were $108 million, and management paid a dividend of $65 million to shareholders against earnings of $401 million.
Management identified several trends which could serve as tailwinds moving forward.
One, non-residential construction activity saw an uptick during the quarter. This drove demand for carbon steel and aluminium, which represented around 30% of first-quarter sales. The automotive market also contributed heavily to the quarter, primarily through its toll-processing operations. The toll processing business processed 4.8% more tons than in Q1 2023, reflecting management’s investments toward increasing capacity in that operation.
Finally, management noted that demand in the semiconductor industry has levelled off. But, it remains positive on the outlook for the market given 1) the CHIPS Act, and 2) investments has made into semiconductor capacity.
Competitive advantages
1. Margins
The first point in which RS has a competitive advantage is at the gross and operating margin. This is crucial in this industry. The company did $14.5 billion in sales in the last 12 months on operating income of $1.6 billion. So a lot gets eaten up before the profit line.
If you can keep the cost of revenues down, then it’s just a matter of keeping running costs as fixed as possible to capture a higher rate on cost. That’s why having a high gross margin is so important – it feeds more income down the P&L.
The higher-than-industry average operating margin also tells me the company likely has low operating costs as a percentage of sales, indicating a combination of 1) production advantages + pricing advantages, and 2) cost advantages, given its enormous customer base and order network.
This is exemplified in Figure 4. It is noticed that net operating profit after tax (post-tax earnings) has remained relatively flat over the last three years on a rolling 12-month basis. It has $9.7 billion of capital tied up in the business as I write. The $9.7 billion of business capital is distributed across a network of around 315 sites in the U.S. and abroad.
The company has invested an additional $39.60 per share into the business to maintain its competitive position. On this, it has delivered an additional $3.40 per share and incremental post-tax earnings, 8.6% marginal returning investment.
Figure 4.
Company filings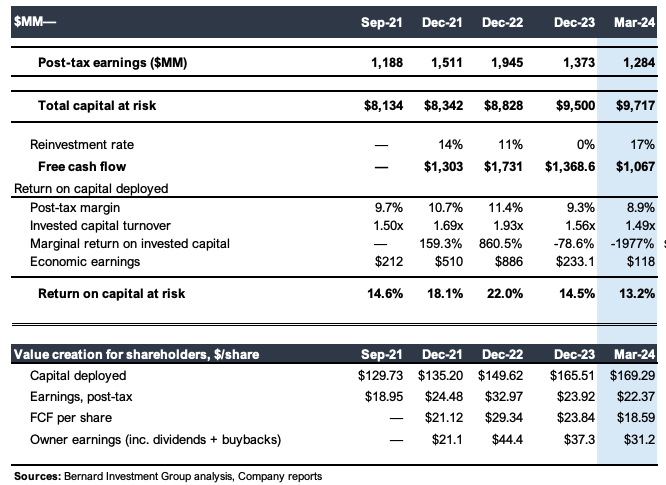
2. Capital-light growth with surplus cash flow
However, the return on this company’s existing capital is more important to us. There aren’t many new opportunities in the steel industry to deploy surplus funds and grow.
What is more attractive to us in this instance Is the fact that RS has routinely thrown off more than $1 billion in free cash flow each rolling 12-month period, each time reinvesting less than 20% of post-tax earnings to achieve this result. This provides tremendous economic leverage on capital deployed, and it is driven by the invested capital turnover, as mentioned earlier.
That’s why we have a double-dip effect. We have higher-than-average margins, but management turns over sales relative to capital at 1.5x each period. Each $1.00 invested in the business returns $1.50 in revenue, therefore (Figure 4).
This is critical to the investment thesis. Both of these factors tell me that RS enjoys consumer advantages and production advantages, as mentioned. It can charge a higher price for its offerings versus the industry average, evidenced by the higher gross margin and higher operating margin; plus, it requires a lower investment of business capital to produce one dollar of revenues versus its competitors.
This is highly attractive. At the time of writing, the company has thrown off free cash flow at a trailing yield of 6.3%, lifting to 10.7%, including all dividends paid up.
One additional:
I’m going to hammer in my points on the gross/operating margin and turnover once more by illustrating a fundamental way of thinking here at Bernard. With its extensive 125,000+ customer list, the company has over 100,000 stock-keeping units (SKUs). Buy any standard; this is exceptionally large.
This kind of SKU count creates an issue for companies looking to move inventories out the door quickly. Costco is actually the leader in the warehouse department Store segment as it relates to this. It has brought its SKU count down from around 6500 more than a decade ago, to just over 4000 today. The result? It’s inventory turnover has remained exceptionally high even as sales have grown.
For RS, this breath of SKU count results in tremendously low inventory turnover (Figure 5). This is one of the disadvantages of having such a wide SKU count – you can’t turn over that many lines quickly.
That is why RS turning over its entire capital base – including the 315 locations mentioned earlier – is highly attractive because it is not just the inventories producing the profits here. There is some economic goodwill in the company offering.
Figure 5.
RS distributes a full line of over 100,000 metal products, including alloy, aluminum, brass, copper, carbon steel, stainless steel, titanium and specialty steel products. (Company filings)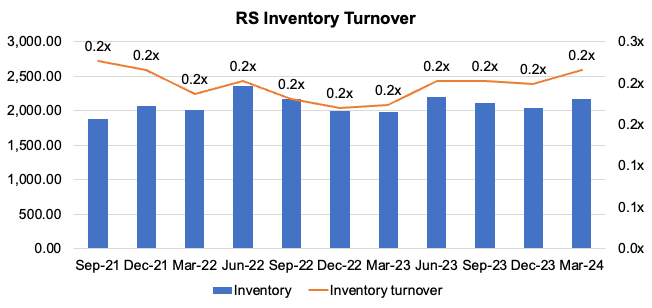
As a result of 1) management actions and 2) producing such high business returns and free cash flow, in my opinion, management has unlocked substantial value for shareholders over the past three years.
We see this in Figure 6. Here, I apply a capital charge of 12% on the firm’s operating assets to observe how much profit it needed to produce to create “economic value” by our definition. Profits are economically valuable if they equal a return on invested capital greater than 12% (this represents the long-term market averages).
Management routinely beat this hurdle over the last three years and has added $100 in economic earnings per share since September 2021. It is unsurprising that its share price rose by around $140 apiece from then to the time of publication.
Figure 6.
Company filings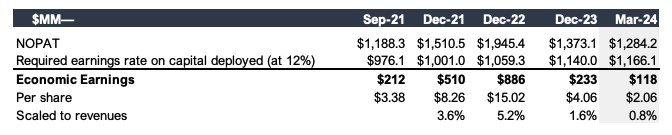
Factors affecting corporate valuation
Now that I’ve established that RS management can create economic value, if it continues along these lines, I need to understand what that looks like. That involves analyzing the firm’s capital requirements and how much cash it can generate over the next few years.
Figure 7 outlines management capital allocation decisions against financial performance over the last three years on a rolling 12-month basis. Sales have grown at a marginal rate of 1.7% per period, on pre-tax margins of almost 14%. To produce a new dollar in sales, management has had to invest $0.24 to fix assets, and $0.35 cents to work capital – primarily in inventories. In total the investment per $1.00 of revenue growth has been $0.70 including all acquisitions made in the past three years. I am attracted to these economics.
Figure 7.
Company filings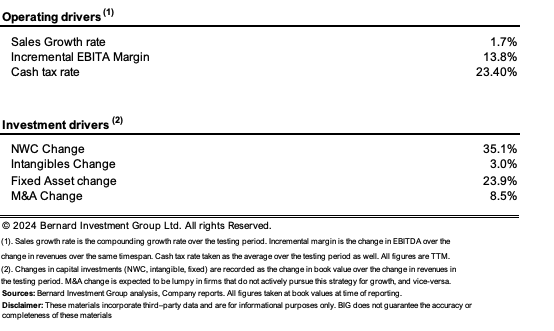
Should management continue this level of operations moving forward, the distribution of outcomes is observed in Figure 8. My numbers project the company to hit $15.7 billion in sales by 2025, ahead of consensus estimates of $14.4 billion. I believe management would invest anywhere from $150 million to $300 million annually back into the business to maintain its competitive position and grow. Based on historical trends, I would also look to around $180 million—$200 million in acquisition-related activity.
Critically, these estimates project RS to throw off $1.4 billion to $1.5 billion in annual free cash flow, requiring and minuscule investment of 10 to 11% of earnings to achieve this. My estimates project a 16% return on invested capital each year to 2025 and that it could compound its intrinsic valuation at 200 basis points per period over this timeframe.
Figure 8.
BIG estimates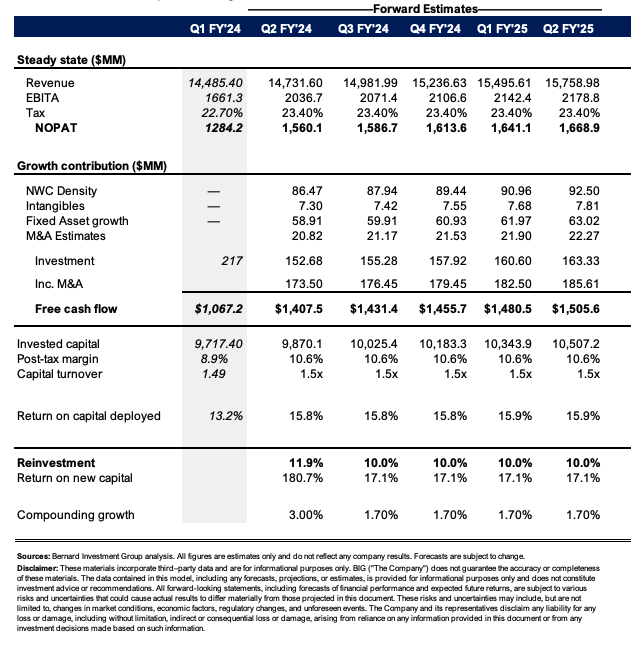
Valuation
In my estimation, the picture gets even more appealing on the valuation front. The stock trades at 14x trading non-GAAP earnings, 11x trailing pre-tax earnings, and 2x the company’s net asset value. You are paying two times book value for a return on equity of 16.4%, netting you, the investor, roughly 8% starting return equity if paying that multiple.
I do not believe the market has got RS priced correctly, even as the sector trades at nearly 19 times trailing earnings. I’m going to run the scenario where management falls in line with consensus estimates on 2024 EBIT. This implies a 14.8% decrease in pre-tax income. If there is no change in the current 11x multiple, the company is worth $15.2 billion in enterprise value to us today. But I want to also understand what could happen if there is a multiple expansion closer to the sector, let’s call it 15x.
In this scenario, even if there is a substantial decline in earnings as expected, the stock is worth $20.6 billion ($360 per share), $3 billion ahead of its current market value, as I write. So much of the valuation is tied up into the earnings component, which leaves room for a large upside surprise, and it doesn’t really fit with the long-term fundamentals of the company anyway.
Figure 9.
BIG estimates
I see this dislocation when projecting the steady-state figures from earlier and discounting them back at the 12% hurdle rate, to arrive at a present value today. I also compound this valuation at the company’s return and invested capital, and its reinvestment rates. This composite valuation arrives at a valuation of $342 per share to us today, otherwise 15x my estimated NOPAT. This supports a buy rating.
Figure 10.
BIG estimates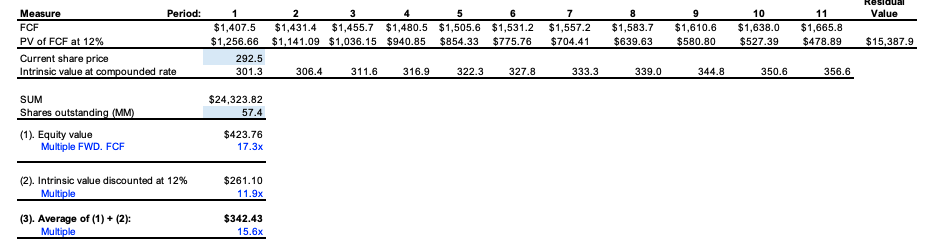
In short
RS stands out as a top pick in the steel industry in my view given 1) its above industry gross margin and operating margins, 2) abnormally low reinvestment of earnings to throw off more than $1 billion in free cash flow on a rolling 12-month basis, 3) statistically high business returns, producing above 12% returns on all capital employed, and 4) attractive valuations that are priced at a discount to the sector.
Based on the culmination of these facts, I estimate the company is worth around $342-$360 per share to me today. Rate buy.
Read the full article here