


Focus of Article
The focus of PART 1 of this article is to analyze Rithm Capital Corp.’s (NYSE:RITM) recent results and compare several of the company’s metrics to 17 mortgage real estate investment trust (mREIT) peers. This analysis will show past and current data with supporting documentation. Table 1a will compare RITM’s investment composition, recent leverage, hedging coverage ratio, and change in investment portfolio size to the 17 mREIT peers. Table 1b will compare RITM’s BV, economic return (loss), and premium (discount) to estimated CURRENT BV using stock prices as of 6/6/2025 to 17 mREIT peers. Table 2a will show an overview of RITM’s investment portfolio, Table 2b will provide a portfolio overview of RITM’s fairly recent acquisition of Sculptor Capital Management Inc. (“SCU”), and Table 2c will provide some details regarding one of the company’s largest current driver of earnings, its mortgage servicing rights (“MSR”) sub-portfolio. Table 3 will show RITM’s recent hedging coverage ratio over the prior 3 quarters (only contributor/team to provide continuous detailed hedging metrics).
I am writing this 2-part article due to requests that such an analysis be specifically performed on RITM versus its mREIT peers at periodic intervals. This article also discusses the importance of understanding the composition of RITM’s investment and derivatives portfolios regarding projecting the company’s future quarterly results as interest rates/yields fluctuate. Understanding the characteristics of a company’s investment and derivatives portfolios can shed some light on which companies are overvalued or undervalued, strictly per a “numbers” analysis. This is not the only data that should be examined to initiate a position within a particular stock/sector. However, I believe this analysis is a good “starting-point” to begin a discussion on the topic.
At the end of this article, there will be a conclusion regarding the following comparisons between RITM and the 17 mREIT peers: 1) trailing 24-month economic return (loss); 2) leverage as of 3/31/2025; 3) hedging coverage ratio as of 3/31/2025; and 4) premium (discount) to my estimated CURRENT BV (BV as of 6/6/2025). My BUY, SELL, or HOLD recommendation and updated price target for RITM will be in the “Conclusions Drawn” section of this article. This includes providing a list of the mREIT stocks I currently believe are undervalued (a buy recommendation), overvalued (a sell recommendation), or appropriately valued (a hold recommendation).
Overview of Several Classifications Within the mREIT Sector
I believe there are several different classifications when it comes to mREIT companies. For the purposes of this article, I am focusing on four. It should be noted, in light of several prior acquisitions and certain changes in overall investment strategies, some mREIT companies have minor-modest sub-portfolios outside each entity’s main concentration. However, I have continued to group certain mREIT companies in each entity’s main classification for purposes of this article. Some market participants (and even some mREIT companies) have different classifications when compared to Table 1a. Some market participants/companies base classifications on the percentage of capital deployed in each entity’s investment portfolio. However, my preference is to base a company’s classification on the monetary “fair market value” (“FMV”) of each underlying portfolio, which, as a fact, is what drives valuation fluctuations. In my professional opinion, there is no “uniform” methodology when it comes to classifying mREIT companies but more of an underlying preference. Readers should understand this as the analysis is presented below.
First, there are mREIT companies who earn a majority of income from investing in fixed-rate agency mortgage-backed securities (“MBS”). These investments consist of commercial/residential MBS, collateralized mortgage obligations (“CMO”), and agency debentures for which the principal and interest payments are guaranteed by government-sponsored enterprises/entities (“GSE”). This is important to understand (especially when markets incorrectly priced in this notion at the onset of COVID-19 in early 2020). Since these investments typically have higher durations versus most other investments within the broader mREIT sector, companies within this classification typically utilize higher hedging coverage ratios in times of rising/elevated mortgage interest rates/U.S. Treasury yields (or a projected rise over the foreseeable future). AGNC Investment Corp. (AGNC), ARMOUR Residential REIT (ARR), Cherry Hill Mortgage Investment (CHMI), Dynex Capital (DX), Annaly Capital Management (NLY), Orchid Island Capital (ORC), and Two Harbors Investment (TWO) are currently classified as a fixed-rate agency mREIT. Out of these 7 agency mREITs, CHMI and TWO currently have a large mortgage servicing rights (“MSR”) sub-portfolio as well. Directly due to low subscriber demand/popularity and sub-sector performance, I decided to drop coverage of Invesco Mortgage Capital (IVR) in January 2025.
Second, there are mREIT companies who earn varying portions of income from investing in agency MBS holdings, non-agency MBS holdings, other securitizations, and non-securitized mortgage-related debt and equity investments (including residential/commercial loans). This type of company is known as a “hybrid” mREIT. In regard to non-agency MBS, this includes (but is not limited to) Alt-A, prime, subprime, and re/non-performing loans where the principal and interest are not guaranteed by a GSE. Since there is no “government guarantee” on the principle or interest payments of non-agency MBS and residential/commercial loans (or rental income on properties), coupons are generally higher when compared to agency MBS of similar maturity. However, borrowing costs (including repurchase agreements) for these specific investments are also higher (no government guarantee; credit risk). Due to the subtle yet identifiable differences between agency MBS, non-agency MBS, and residential/commercial loans, I like to differentiate between an agency and a hybrid mREIT company. Since there is credit risk when it comes to non-agency MBS and residential/commercial loans, leverage ratios are typically lower when investing in these securitizations/investments when compared to agency MBS (even when credit risk remains low). Chimera Investment Corp. (CIM), Ellington Financial Inc. (EFC) (converted to a REIT in 2019), MFA Financial (MFA), AG Mortgage Investment Trust (MITT), New York Mortgage Trust (NYMT), and Ready Capital (RC) are currently classified as a hybrid mREIT.
Third, there are mREIT companies that invest in, but are not limited to, a combination of agency MBS, non-agency MBS, credit risk transfers (“CRT”), other mortgage-related investments, non-securitized debt investments (including residential, multifamily, and commercial loans), and MSRs. There are also mREIT companies that have underlying subsidiaries who directly originate mortgages (including via correspondent production) and/or mortgage-related debt products. I currently believe RITM and PennyMac Mortgage Investment Trust (PMT) should be classified as an “originator and servicer” mREIT. RITM has also fairly recently become an asset manager to several subsidiaries/affiliates; one being the publicly traded Rithm Property Trust (RPT). Since RITM and PMT currently have at least a modest portion of the company’s investment portfolio in MSR and MSR-related investments, which act as an “indirect” hedge (the same can be said regarding interest only [IO] securities), these companies do not need to utilize as high of a hedging coverage ratio when compared to the agency mREIT sub-sector (some could even argue not to have derivative instruments in place; if anything, “contra” hedges to counter a drop in rates/yields). Indirect hedges are not calculated within each company’s hedging coverage ratio within this analysis (not the main purpose of these investments). As I have pointed out in the past, these investments actually benefit, from a valuation standpoint, in a rising/elevated interest rate environment as prepayment risk (and in a majority of scenarios credit risk) decreases/remains low while there is an increase in projected future discounted cash flows (and vice versa).
Finally, there are mREIT companies that basically solely invest in non-securitized, commercial whole loans with underlying collateral (real estate) tied to offices, multifamily units, hotels, retail stores, industrial complexes, and other miscellaneous types of properties. Regarding the 3 commercial whole loan mREIT peers I currently cover, Blackstone Mortgage Trust, Inc. (BXMT), Franklin BSP Realty Trust, Inc. (FBRT), and Granite Point Mortgage Trust Inc. (GPMT), these companies typically originate/invest in variable-rate, interest-only senior secured (typically first lien) debt. Since BXMT, FBRT, and GPMT all had 98%+ of its investment portfolio in variable-rate debt as of 3/31/2025, these companies currently do not need to utilize a high hedging coverage ratio (some could even argue not to have derivative instruments in place; LIBOR/SOFR floors are a good substitute as well). Directly due to low subscriber demand/popularity and sub-sector performance, I decided to drop coverage of Ares Commercial Real Estate Corp. (ACRE) in January 2025.
Now let us start the comparative analysis between RITM and the 17 mREIT peers.
Leverage, Hedging Coverage Ratio, BV, Economic Return (Loss), and Premium (Discount) to Estimated Current BV Analysis – Overview
Let us start this analysis by first getting accustomed to the information provided in Table 1a and 1b below. This will be beneficial when explaining how RITM compares to the 17 mREIT peers in regard to the metrics stated earlier.
Table 1a – mREIT Asset Composition, Leverage, Hedging Coverage Ratio, and Change in Investment Portfolio Size
The REIT Forum
(Source: Table created by me, calculating asset compositions, leverage, and hedging coverage ratios from data provided by the SEC’s EDGAR Database)
Table 1a above provides the following information on RITM and the 17 mREIT peers (see each corresponding column): 1) generalized MBS/investment portfolio composition as of 3/31/2025; 2) on-balance sheet leverage ratio as of 3/31/2025; 3) at-risk (total) leverage ratio as of 3/31/2025; 4) hedging coverage ratio as of 3/31/2025; 5) quarterly change in hedging coverage ratio (3/31/2025 versus 12/31/2024); 6) hedging weighted average tenor/maturity; 7) change in investment portfolio size (excludes off-balance sheet transactions); and 8) non-accrual percentage of certain select mREIT peers as of 3/31/2025. Some readers may notice some mREIT peers have “two sets” of leverage ratios within one color set. This is due to the fact I break out both non-recourse and recourse leverage. Within the two sets of leverage ratios within one column, recourse leverage ratios are represented by the lower figure on the right-hand side and are deemed more important.
Table 1b – BV, Economic Return (Loss), and Premium (Discount) to Estimated Current BV Analysis
The REIT Forum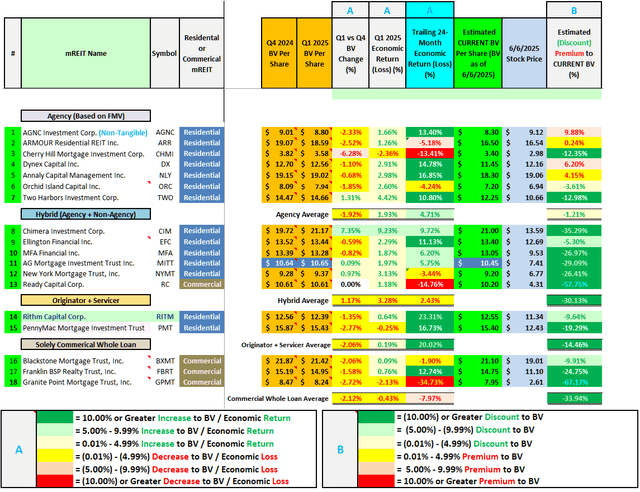
(Source: Table created by me, obtaining historical stock prices from NASDAQ and each company’s BV per share figures from the SEC’s EDGAR Database [link provided below Table 1a])
Table 1b above provides the following information on RITM and the 17 mREIT peers (see each corresponding column): 1) BV per share at the end of Q4 2024; 2) BV per share at the end of Q1 2025; 3) BV per share change during Q1 2025 (percentage); 4) economic return (loss) (change in BV and dividends accrued for/paid) during Q1 2025 (percentage); 5) economic return (loss) during the trailing 24-months (percentage); 6) my estimated CURRENT BV per share (BV as of 6/6/2025); 7) stock price as of 6/6/2025; and 8) 6/6/2025 premium (discount) to my estimated CURRENT BV (percentage).
Now that an overview has been provided, let us start the comparative analysis.
Analysis of RITM
Using Table 1a above as a reference, as of 3/31/2025 RITM’s investment portfolio consisted of 21% and 0% fixed- and variable-rate agency MBS, respectively (based on FMV). When compared to 12/31/2024, RITM’s percentage of fixed- and variable-rate agency MBS increased 3% and remained unchanged, respectively. RITM also had 36% allocated to MSR investments. When calculated, this sub-sector decreased (1%). Finally, RITM continued to invest in non-agency MBS and non-MBS holdings (mainly mortgage-related residential whole loans) which accounted for 43% of the company’s investment portfolio balance as of 3/31/2025. When calculated, this combined sub-sector decreased (2%). When broken out, as will be indirectly shown in Table 2a in a bit (via a handful of operating companies), this sub-sector included, but was not limited to, RITM’s investments in residential whole loans, single-family rentals (“SFR”), consumer finance loans, commercial real estate (very minor proportion), other miscellaneous mortgage-related investments, and more recently asset management services.
When excluding borrowings collateralized by assets held in “securitization trusts” (non-recourse debt), RITM had an on-balance sheet leverage ratio of 2.6x while the company’s at-risk (total) leverage ratio, when including its off-balance sheet net (short) “to-be-announced” (“TBA”) MBS position, was 1.1x as of 3/31/2025. RITM had an on-balance sheet and at-risk (total) leverage ratio of 2.7x and 0.9x as of 12/31/2024, respectively. As such, RITM very slightly decreased and very slightly increased the company’s on-balance sheet and at-risk (total) leverage during Q1 2025, respectively. This was mainly due to RITM’s relatively unchanged on-balance sheet investment portfolio size and a very minor decrease in the company’s net (short) TBA MBS position during the quarter. As of 3/31/2025, RITM continued to have a lower at-risk (total) recourse leverage ratio by a pretty good margin when compared to the other originator + servicer mREIT sub-sector peer within this analysis, PMT.
Moving on, using Table 1b above as a reference, RITM had a BV of $12.56 per common share at the end of Q4 2024. RITM had a BV of $12.39 per common share at the end of Q1 2025. This calculates to a quarterly BV decrease of (1.35%). I projected a very accurate RITM 3/31/2025 BV projection on the Investing Group subscriber side (2nd straight quarter within 0.50%). When including RITM’s quarterly dividend of $0.25 per common share, the company had an economic return of 0.64% for Q1 2025. RITM’s quarterly BV decrease and economic return was mainly the result of a minor – modest decrease in mortgage interest rates/U.S. Treasury yields during Q1 2025. A detailed earnings assessment article was previously provided to Investing Group subscribers. In fact, all 18 mREIT earnings results were previously discussed with Investing Group subscribers in “real time” through earnings assessment articles.
Even with the minor BV decrease during Q1 2025, unlike basically all other mREIT sector peers, RITM has actually been able to grow the company’s BV over the prior 3+ years as mortgage interest rates/U.S. Treasury yields quickly net increased. This continued to lead to a notable economic return outperformance for RITM and something I correctly projected prior to the 2022–2023 Fed/FOMC hiking cycle. This notable outperformance should continue to be seen as a positive catalyst/trend. To understand RITM’s recent economic return dominance, it is important to have a basic understanding of what the company invests in and how it is different when compared to most broader mREIT sector peers. Table 1a above provided a good starting point for this distinction. However, let us now further discuss RITM’s investment and derivatives portfolios to spot certain characteristics which have impacted (and will impact future) results. Table 2a below provides an overview of RITM’s recent investment portfolio.
Table 2a – RITM Investment Portfolio Overview
Quarterly Shareholder Presentation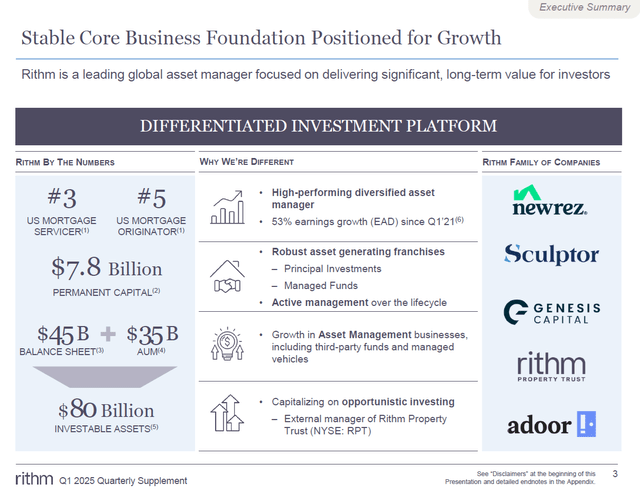
(Source: Table obtained from RITM’s quarterly shareholder presentation.)
Using Table 2a above as a reference, RITM’s investment portfolio consists of the following larger operating companies: 1) Newrez (originator of mortgage loans and servicer of MSRs and excess MSRs [among other mortgage-related products]); 2) SCU (largely private credit investments [RITM is the asset manager]); 3) Genesis Capital (residential transitional/bridge loan lending); 4) RPT (publicly traded mREIT who originates/purchases commercial real estate loans [RITM is the asset manager]); and 5) Adoor (SFR investments). RITM also owns a handful of other smaller operating companies which invest in, but are not limited to, consumer loans and other financial/mortgage-related assets.
Simply put, when compared to say a typical agency mREIT peer, RITM has a very wide array of financial investments. This added diversification directly results in “natural/contra hedges” versus the agency mREIT sub-sector.
For instance, when mortgage interest rates/U.S. Treasury yields net increase, generally all agency mREIT sub-sector peers typically experience BV decreases over a prolonged period of time. This becomes especially true when spread/basis risk spikes (as we have seen at times in the past). This is due to the fact the value of long-term, fixed-rate agency MBS prices decrease, which is only partially mitigated by related hedging/derivative instruments. However, within RITM’s investment portfolio, the company has allocated a notable proportion of capital to MSR and MSR-related assets. As extensively discussed in the past, mainly through our Investing Group, MSR and MSR-related assets typically gain in value when mortgage interest rates/U.S. Treasury yields net increase (or remain fairly elevated). Of course, fully modeling out valuation fluctuations within each of RITM’s sub-portfolios is much more involved than this basic statement (again, something we do on the subscriber side) but readers should get the basic “gist” of this relationship for purposes of this sector comparison article.
Table 2a is simply providing a basic understanding of the underlying operating companies that are owned/managed by RITM. This includes numerous existing underlying subsidiaries (which includes a handful of prior acquisitions) and more recently 3 closed acquisitions/transitions, SCU, Specialized Loan Servicing LLC (“SLS”), and taking over the managerial duties of the aforementioned public mREIT, RPT (formerly known as Great Ajax Corp. [AJX]). Again, the key point here is continued acquisitions within core business operations (MSR-related investments regarding SLS) while also broadening diversification within new investment opportunities (acquiring another asset manager regarding SCU and picking up managerial duties regarding RPT/AJX).
Table 2b – SCU Asset Management Overview
Quarterly Shareholder Presentation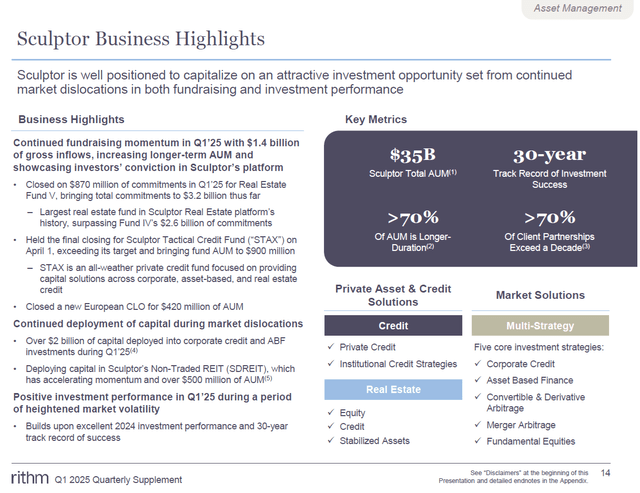
(Source: Table obtained from RITM’s quarterly shareholder presentation [link provided below Table 2a; added updates where applicable].)
Using Table 2b above as a reference, RITM’s fairly recently acquired SCU had $35 billion of investments under management as of 3/31/2025. This includes investments within the following: 1) private/corporate credit; 2) asset-based finance (structured credit + solutions); 3) real estate credit; 4) leveraged loans; 5) opportunist debt and equity investments within real estate; and 6) strategic investments in multiple types of other financial instruments. Simply put, a common theme with RITM, diversification (a “ramp up” of asset management services) and economies of scale to drive future growth and returns.
While RITM continues to have a diverse array of underlying subsidiaries and investment segments, one of the company’s main drivers of BV fluctuations and earnings remains its MSR and MSR-related investments. As such, let us take a quick look at RITM’s MSR sub-portfolio via Table 2c below.
Table 2c – RITM MSR Sub-Portfolio Overview
Quarterly Shareholder Presentation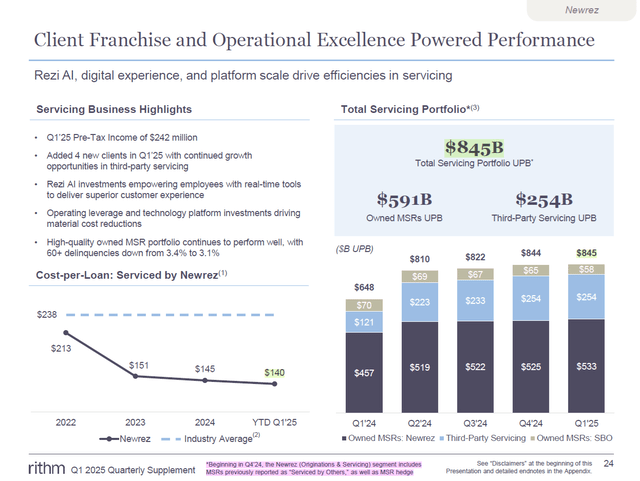
(Source: Table obtained from RITM’s quarterly shareholder presentation [link provided below Table 2a].)
Using Table 2c above as a reference, let us provide an overview of some key metrics regarding this sub-portfolio. RITM’s total MSR sub-portfolio consisted of an underlying unpaid principal balance (“UPB”) of $845 billion as of 3/31/2025. This was basically unchanged when compared to an underlying UPB of $844 billion as of 12/31/2024, but a notable increase when compared to an underlying UPB of $648 billion as of 3/31/2024. This was basically solely due to the fairly recently closed acquisition of SLS (occurred during Q2 2024). In addition, RITM’s servicing cost per loan net decreased from $213 during 2022 to $140 during Q1 2025. Simply put, an attractive net decrease over the prior 2+ years, which was the result of continued technological improvements within RITM’s origination/servicing platform (implementing Rezi AI) and operational synergies. RITM continues to be at the forefront in this regard.
Moving to credit metrics, RITM’s total full MSRs had a 60-day+ delinquency rate of 3.4% during Q3 – Q4 2024 which slightly decreased to 3.1% during Q1 2025. I correctly anticipated a minor “uptick” during 2024. That said, this percentage remains near recent historical lows. However, to remain unbiased, I anticipate a minor – modest uptick in delinquency rates over the foreseeable future (2025–2026) but nothing overly “alarming”; even if the economy moves into a mild recession (4.0% – 6.0%). This is already factored into our modeling, per share recommendation ranges, and risk/performance rating. Further analysis of RITM’s underlying investment sub-portfolios is outside the scope of this particular sector comparison article (and provided within our Investing Group).
Moving on, to highlight the recent activity within RITM’s derivatives portfolio, Table 3 is presented below.
Table 3 – RITM Hedging Coverage Ratio (As of 3/31/2025 Versus Prior 2 Quarters)
The REIT Forum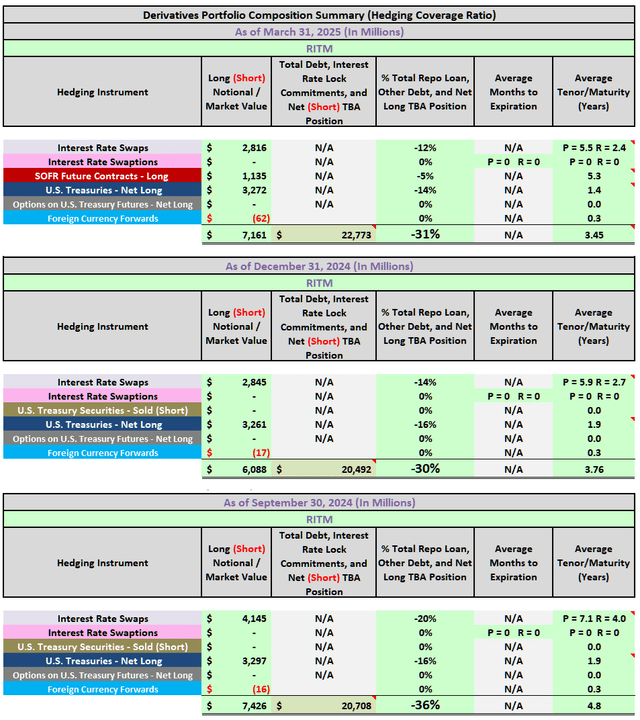
(Source: Table created by me, partially using RITM data obtained from the SEC’s EDGAR Database [link provided below Table 1a])
Since one of RITM’s main investments are MSR and MSR-related assets, the company also invests in fixed-rate agency MBS, which act as a natural hedge to said investments. However, to take RITM’s derivatives/hedging strategy one step further, to further combat interest rate/spread risk inherently associated with fixed-rate agency MBS, the company also utilizes interest rate (payer) receiver swaps, net (short) long U.S. Treasury securities, and net (short) TBA MBS investments.
Using Table 3 above as a reference, RITM actually switched to a net long U.S. Treasury securities position during Q3 2024. In addition, RITM continued to add to the company’s interest rate receiver swaps (which equates to a net long position) during Q3 2024. As such, when calculated, RITM’s hedging coverage ratio decreased from (2%) as of 6/30/2024 to (36%) as of 9/30/2024. As such, RITM was preparing for lower overall mortgage interest rates/U.S. Treasury yields heading into late 2024.
RITM slightly decreased the company’s interest rate receiver swaps while basically maintaining its net long U.S. Treasury securities during Q4 2024. When calculated, RITM’s hedging coverage ratio increased to (30%) as of 12/31/2024. As such, RITM was still preparing/ready for lower overall mortgage interest rates/U.S. Treasury yields heading into 2025.
RITM basically maintained the company’s interest rate receiver swaps and net long U.S. Treasury securities during Q1 2025. RITM also added minor net long SOFR futures contracts during Q1 2025. When calculated, RITM’s hedging coverage ratio very slightly decreased to (31%) as of 3/31/2025. As such, RITM was still preparing/ready for lower overall mortgage interest rates/U.S. Treasury yields during 2025.
Moving on, once again using Table 1b above as a reference, as of 6/6/2025 RITM’s stock price traded at $11.34 per share. When calculated, RITM’s stock price was trading at a (9.64%) discount to my estimated CURRENT BV (BV as of 6/6/2025; $12.55 per common share). Simply put, RITM’s stock price traded at a modest (more than a 5% but less than a 10%) discount to my estimated CURRENT BV. I continue to believe RITM “deserves” to trade at a slightly – modestly higher valuation when compared to the company’s closest sub-sector peer, PMT, and a modestly higher valuation when compared to most broader sector mREIT peers.
I believe the trailing 24-month total economic return (loss) metric is a great tool in spotting each mREIT’s historical performance and when considering future general expectations versus peers. RITM’s current valuation is slightly more attractive when compared to last quarter’s article. As such, as stated later in the article, I currently believe RITM is slightly undervalued (a BUY recommendation) from a stock price perspective.
Comparison of RITM’s Recent Economic Return (Loss), Leverage, Hedging Coverage Ratio, and Valuation to 17 mREIT Peers in Ranking Order:
The REIT Forum Feature
Conclusions Drawn (PART 1)
PART 1 of this article has analyzed RITM and 17 mREIT peers in regard to the following metrics: 1) trailing 24-month economic return (loss); 2) leverage as of 3/31/2025; 3) hedging coverage ratio as of 3/31/2025; and 4) premium (discount) to my estimated CURRENT BV.
First, RITM’s trailing 24-month economic return of 23.31% was the most attractive/best performer out of all the covered mREIT peers (both sub-sector and broader sector peers). For example, the agency, hybrid, originator + servicer, and commercial whole loan trailing 24-month economic return (loss) average was 4.71%, 2.43%, 20.02%, and (7.97%), respectively. This was mainly due to the recent composition of RITM’s investment and derivatives portfolio and the net movement of mortgage interest rates/U.S. Treasury yields during this timeframe. Extremely detailed reasoning of RITM’s recent economic return outperformance was provided in quarterly earnings assessment articles (Investing Group feature). I expect this outperformance to continue during 2025.
Second, RITM’s at-risk (total) leverage as of 3/31/2025 remained below both the originator + servicer sub-sector and broader mREIT sector average. RITM typically runs below-average leverage versus the company’s closest sector peer, PMT, and agency mREIT peers when looking back multiple years. This helps combat BV volatility.
Third, RITM’s hedging coverage ratio remained geared towards lower mortgage interest rates/U.S. Treasury yields. This is directly the reason why, even with sharply declining rates/yields during Q2 + Q4 2024, RITM only recorded a very minor – minor quarterly BV decrease. To remain unbiased, RITM should be considered more of a “contra mREIT play”. RITM typically notably outperforms most (if not all) broader sector peers in a rising/elevated interest rate environment but will gravitate towards sector averages when mortgage interest rates/U.S. Treasury yields net decrease to, at the least, a modest extent.
Finally, RITM’s current discount, when compared to my estimate of each mREIT’s CURRENT BV (BV as of 6/6/2025), was modestly less attractively valued when compared to PMT. However, through the metrics provided within this two-part sector comparison article (including factors/metrics not directly discussed), I believe RITM “deserves” to trade at a premium valuation versus basically all mREIT peers (including PMT).
Simply put, RITM remains well diversified (and recently has diversified even more) to deliver attractive risk-adjusted returns over multiple interest rate scenarios. As such, this is one of the reasons why I believe RITM is currently undervalued (not overvalued). I would strongly suggest readers consider CURRENT BVs (as opposed to prior period BVs) when assessing whether a stock is attractively valued or not (available to Investing Group subscribers on a weekly basis).
Dependent upon the metrics laid out in the tables above, results across the broader mREIT sector will slightly – notably vary from peer-to-peer; dependent upon specific asset classifications and risk management strategies put into place. The relationship between MBS/investment pricing and derivative instrument valuations needs to be constantly monitored (which I continually perform throughout the quarter).
The prior Caliber Homes and Genesis acquisitions should continue to benefit RITM as a whole. The same holds true regarding RITM’s partial equity stake in GreenBarn, a subsidiary focused on investments in commercial real estate (again, thinking longer-term here), and the company’s recent acquisitions of Sculptor and SLS. Regarding Sculptor, RITM acquired assets at an attractive price (albeit at a less attractive price after a “bidding war”) and has recently begun the company’s transition to also being an asset manager. Sculptor began contributing to the “bottom line” during Q4 2023 and reported nice fee/revenue growth during Q2 2024 which “exploded” higher during Q4 2024 (though saw a large, anticipated dip during Q1 2025 to remain unbiased). Regarding SLS, this recent acquisition was right in the company’s “ballpark” per se; MSRs and related assets (including an origination servicing business). As stated at the time this acquisition was first announced, I believe this was a smart decision by RITM. This has immediately driven UPB and earnings growth for RITM (as correctly anticipated).
3 quarters ago, RITM also took over the managerial duties for RPT (formerly Great Ajax Corp. [AJX]) and recently transitioned this mREIT into commercial loans/investments (as opposed to residential). This will indirectly provide RITM some added exposure to commercial real estate at historically low/very attractive pricing in certain property types/tranches. Positive progress has already been achieved by this mREIT. This should eventually add a bit to RITM’s asset management revenues, but I stress this will only have a very minor impact for quite some time (basically immaterial at this point; $247 and $296 million of RPT equity as of 12/31/2024 and 3/31/2025, respectively). RITM also has a minor equity and warrant stake in RPT. As such, RITM continues to diversify the business model into areas outside residential mortgages and mortgage-related investments.
Last quarter, RITM also announced a future global energy infrastructure platform with Scale Capital Partners. This partnership/fund will supply power to data centers globally. This is something certainly “outside RITM’s box” per se but could be a very interesting/exciting addition. Details were limited regarding this venture, as it technically has not been officially publicly disclosed yet. As recently stated in chat discussions, this platform could be tied to RITM’s recent sponsor of Rithm Acquisition Corp. (RAC), a special purpose acquisition company (“SPAC”). No new material developments were provided about this venture in conjunction with Q1 2025 earnings.
Management remains in the process of likely “spinning-off” RITM’s mortgage origination/servicing businesses (including, but not necessarily limited to, Newrez/Caliber/Shellpoint). This has been discussed, at length, within our Investing Group starting way back in 2020–2021. The “value unlocking” of these sub-portfolios, by likely spinning off several subsidiaries, forming a new entity, and taking it public (current RITM shareholders would theoretically own shares in the newly formed public entity), would be a positive catalyst/trend. This possibility has been built into our bifurcated modeling for RITM since 2019 (separate BVs). As such, this entire concept has already been taken into consideration regarding RITM’s percentage recommendation ranges, risk rating, and price target. Readers need to remain patient on this potential 2025 – early 2026 event (regarding all financial reporting impacts).
My Buy, Sell, or Hold Recommendation
From the analysis provided above (using Table 1b as a direct reference), including additional catalysts/factor not discussed within this article, I currently rate RITM as a SELL when I believe the company’s stock price is trading at or greater than a 5% premium to my projected CURRENT BV (BV as of 6/6/2025; $12.55 per share), a HOLD when trading at less than a 5% premium through less than a (7.5%) discount to my projected CURRENT BV, and a BUY when trading at or greater than a (7.5%) discount to my projected CURRENT BV.
Therefore, with a closing price as of 6/10/2025 of $11.36 per share, I currently rate RITM as slightly UNDERVALUED from a stock price perspective.
As such, I currently believe RITM is a BUY recommendation (but close to a HOLD recommendation).
To remain unbiased, I/we had a NOTABLY UNDERVALUED classification (STRONG BUY recommendation) on RITM (and most of the broader mREIT sector) in early 2023 which quickly “paid off” to readers/subscribers who heeded our prior advice. So, currently not as great of value versus early 2023 (just shows I am unbiased as I continue to have a large sector position in RITM).
My current price target for RITM is approximately $13.20 per common share. This is currently the price where my recommendation would change to OVERVALUED/a SELL recommendation. The current price where my classification/recommendation would change to UNDERVALUED/a BUY recommendation is approximately $11.60 per common share. Put another way, the following are my CURRENT BUY, SELL, or HOLD per share recommendation ranges (our Investing Group subscribers get this type of data on all 18 mREIT (and 12 business development company [BDC]) stocks I currently cover on a weekly basis):
$13.20 per share or above = SELL
$11.61 – $13.19 per share = HOLD
$10.06 – $11.60 per share = BUY
$10.05 per share or below = STRONG BUY
Along with the data presented within this article, this recommendation considers the following mREIT catalysts/factors: 1) projected future MBS/investment price movements; 2) projected future derivative valuations; and 3) projected near-term (up to 1-year) dividend per share rates. This includes all recent, current, and projected macroeconomic indicators and FOMC monetary policy. This also considers the potential RITM future spin-off of the company’s origination/servicing/mortgage operations.
mREIT Sector Recommendations as of 6/6/2025
Table 9 – Past and Current mREIT Recommendations
The REIT Forum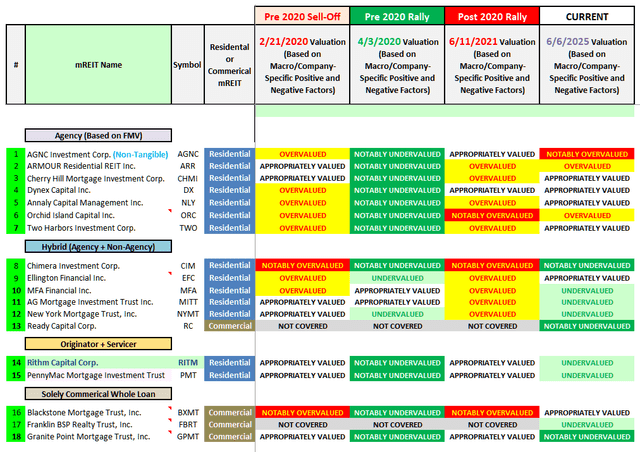
(Source: Table created by me, including all past and present recommendations based on data obtained from the SEC’s EDGAR Database [link provided below Table 1a])
Table 9 above provides the following information on RITM and the 17 mREIT peers (see each corresponding column): 1) 2/21/2020 BUY, SELL, or HOLD recommendation (pre-COVID-19 sell-off); 2) 4/3/2020 BUY, SELL, or HOLD recommendation (pre-COVID-19 rally); 3) 6/11/2021 BUY, SELL, or HOLD recommendation (post COVID-19 rally and prior to “hawkish” FOMC monetary policy); and 4) 6/6/2025 BUY, SELL, or HOLD recommendation range, relative to my estimated CURRENT NAV.
I currently have 3 mREITs rated as a STRONG BUY, 6 rated as UNDERVALUED (BUY), 6 rated as APPROPRIATELY VALUED (HOLD), 2 rated as OVERVALUED (SELL), and 1 as NOTABLY OVERVALUED (STRONG SELL). That said, understand each mREIT has its own assigned risk/performance rating (which factors in time horizons) which is provided to Investing Group subscribers.
The analysis performed above does not provide “every” catalyst/factor to consider when choosing a mREIT investment. However, I believe this analysis is a good starting point to begin a discussion on the topic. Additional metrics will be analyzed in PART 2 of this article. PART 2 will take a look at RITM’s past and current dividend rates, yields, and other similar metrics and compare the results to the 17 other mREIT peers. Several of these metrics have a direct impact on future operations/results as events unfold. This includes dividend projections for all 17 peers for Q3 2025.
My Personal RITM Past + Current Stock Disclosures
The following are my RITM (formerly NRZ) past and current stock disclosures and total returns since I have been writing on Seeking Alpha (since 2013):
Table 10 – RITM Past + Current Stock Disclosures/Returns
The REIT Forum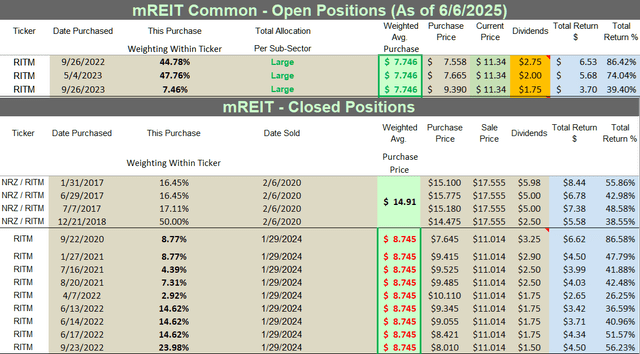
Source: Taken Directly from the REIT Forum’s Spreadsheets/Data
Final Note: All trades/investments I have performed over the past 8+ years have been disclosed to readers in “real time” (that day at the latest) via Seeking Alpha and, more recently, the “live chat” feature of our Investing Group (which cannot be changed/altered). Beginning in January 2020, I transitioned all my real-time purchase and sale disclosures solely to subscribers of the REIT Forum. All applicable public articles will still have my “main ticker” purchase and sale disclosures (just not real-time alerts). At the end of May 2025, I had an unrealized/realized gain “success rate” of 90.0% and a total return (includes dividends received) success rate of 96.3% out of 80 total past and present mREIT and BDC positions (updated monthly; multiple purchases/sales in one stock count as one overall position until fully closed out). I encourage other Seeking Alpha contributors to provide real-time buy and sell updates for their readers/subscribers, which would ultimately lead to greater transparency/credibility.
Simply put, a contributor’s/team’s recommendation track record should “count for something” and should always be considered when it comes to credibility/successful investing.
Understanding My/Our Valuation Methodology Regarding mREIT Common and BDC Stocks
The basic “premise” around my/our recommendations in the mREIT common and BDC sectors is value. Regarding operational performance over the long term, there are above average, average, and below average mREIT and BDC stocks. That said, better-performing mREIT and BDC peers can be expensive to own, as well as being cheap. Just because a well-performing stock outperforms the company’s sector peers over the long-term, this does not mean this stock should be owned at any price. As with any stock, there is a price range where the valuation is cheap, a price where the valuation is expensive, and a price where the valuation is appropriate. The same holds true with all mREIT common and BDC peers. As such, regarding my/our investing methodology, each mREIT common and BDC peer has their own unique BUY, SELL, or HOLD recommendation range (relative to estimated CURRENT BV/NAV). The better-performing mREITs and BDCs typically have a recommendation range at a premium to BV/NAV (varying percentages based on overall outperformance) and vice versa with the average/underperforming mREITs and BDCs (typically at a discount to estimated CURRENT BV/NAV).
Each company’s recommendation range is “pegged” to estimated CURRENT BV/NAV because this way subscribers/readers can track when each mREIT and BDC peer moves within the assigned recommendation ranges (daily if desired). That said, the underlying reasoning why I place each mREIT and BDC recommendation range at a different premium or (discount) to estimated CURRENT BV/NAV is based on roughly 15–20 catalysts which include both macroeconomic catalysts/factors and company-specific catalysts/factors (both positive and negative). This investing strategy is not for all market participants. For instance, not likely a “good fit” for extremely passive investors. For example, investors holding a position in a particular stock, no matter the price, for say a period of 5+ years. However, as shown throughout my articles written here at Seeking Alpha since 2013, in the vast majority of instances I have been able to enhance my personal total returns and/or minimize my personal total losses from specifically implementing this particular investing valuation methodology. I hope this provides some added clarity/understanding for new subscribers/readers regarding my valuation methodology utilized in the mREIT common and BDC sectors.
Each investor’s BUY, SELL, or HOLD decision is based on one’s risk tolerance, time horizon, and dividend income goals. My personal recommendation will not fit each reader’s current investing strategy. The factual information provided within this article is intended to help assist readers when it comes to investing strategies/decisions. Please disregard any minor “cosmetic” typos if/when applicable.
Build a foundation for steady income with REITs
As demand for key real estate sectors increases and supply fails to keep pace, 2025 presents a prime opportunity to invest in REITs, Preferreds, and BDCs.
The REIT Forum offers a proven, transparent approach with actionable insights. Subscribers receive precise trade alerts, portfolio tracking, and exclusive articles. Strategies from The REIT Forum have consistently outperformed sector indexes for nearly a decade.
Start your risk-free two-week trial today and capitalize on the power of real estate returns.
—-
Editor’s Note: This article covers one or more microcap stocks. Please be aware of the risks associated with these stocks.
Read the full article here