

Introduction
Vancouver-based Sandstorm Gold (NYSE:SAND) released its preliminary 3Q23 production results on October 5, 2023.
Note: This article updates my previous article on Sandstorm Gold, published on July 10, 2023. I have been following SAND’s quarterly results since 2015.
1 – 3Q23 Production and preliminary revenues
- Sandstorm Gold sold approximately 21,100 attributable GEOs and realized preliminary revenue of $41.2 million in 3Q23 (22,606 attributable GEOs and $39.0 million in revenue for the comparable period in 2022).
- The preliminary cost of sales, excluding depletion for the 2Q23 year, was $4.6 million, resulting in cash operating margins of approximately $1,700 per attributable Gold equivalent ounce ($7.3 million and $1,383 per attributable GEOs for the comparable period in 2022).
- The Company’s gold price 3Q23 was estimated at $1,919 per ounce.
SAND had a debt of $467 million in 2Q23, with a total cash of $24.95 million. We got some limited information about the debt repayment for 3Q23.
While we do not know the cash on hand as of 3Q23, a quick read of the recent presentation on page 23 indicates that the debt is $457 million as of August 3, 2023, which means that SAND repaid $10 million this quarter.
SAND Quarterly Cash versus Debt History 2Q23 (Fun Trading)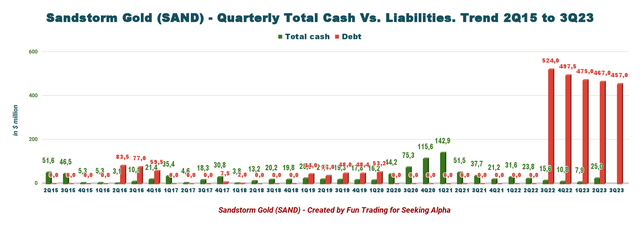
Also, the Company indicated that it expects to pay off the debt between 2027 and 2028, depending on the price of gold, silver, and copper.
SAND Repayment (SAND Presentation August 3)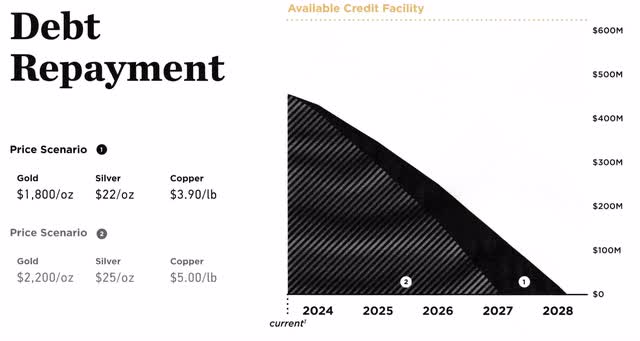
Finally, the debt net of investment (loans to companies) is $223 million.
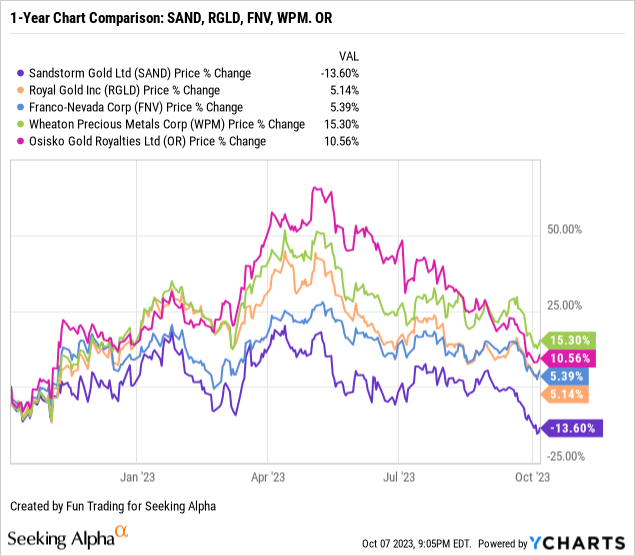
2 – Stock Performance
Sandstorm Gold is still one of the worst performers in this segment and is down nearly 14% on a one-year basis. However, even a broken clock is right twice a day, and I hope that SAND will bounce back soon, even if it is temporary.
3 – Investment Thesis
As I said in my preceding article, I consider SAND an outstanding trading tool, but presents limited interest as a long-term investment, at least for 2023 and 2024. My three streamers of choice are Franco-Nevada (FNV), Royal Gold (RGLD), and Wheaton Precious Metals (WPM).
The Company has been involved with numerous financial deals that present long-term potential for growth. SAND indicated a 15-year outlook with 125K GEOs (75% from Gold) and 95K GEOs in 2023 (49% from Gold).
Sadly, this impressive long-term outlook has not translated into any noticeable benefits for shareholders, and the stock price is back to a multi-year low again.
SAND 15-Year Outlook (SAND Presentation)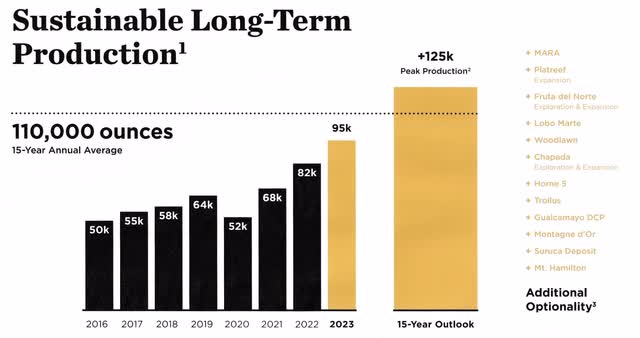
Still, I believe the recent selloff affecting the gold industry offers a great opportunity here, and I recommend using the stock weaknesses to accumulate below $4.60.
Furthermore, the Company is now paying a dividend yield of 1.31%, which helps to be patient.
After trading well above $1,900 until late August, the gold price tumbled in September after learning that the Fed might raise interest rates by 25 points again in December 2023. Furthermore, in late August, the Fed chairman J. Powell took a hawkish tone in his speech at Jackson Hole,
noting that while inflation has tumbled in recent months, it isn’t yet at an acceptable level. Officials at the central bank are prepared to do whatever it takes to bring the rate down to the 2% target, he said.
“Although inflation has moved down from its peak—a welcome development—it remains too high, Powell said Friday.
These comments triggered a significant gold selloff, pushing the stock to the low 1,800s, with a close at $1,845 per ounce (continuous contracts) on Friday. However, on the bright side, we have found a new lower support now.
SAND 1-Year Chart Gold, Silver, Copper (Fun Trading StockCharts)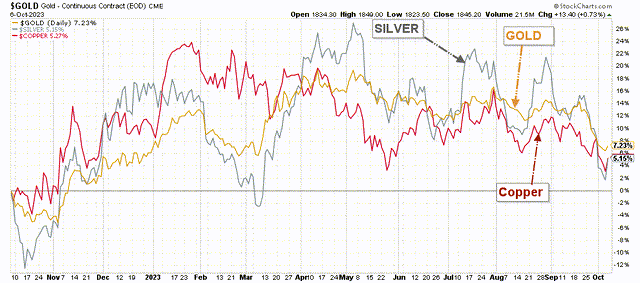
The immediate effect of this volatile situation is that SAND broke down its trading pattern in the last few weeks and appears to have reached lower support on Friday, which is positive when trading short-term LIFO.
SAND investors have not been very lucky, and the stock has performed poorly. We must return to December 2018 to see SAND trading around $4.50! However, investing is all about looking forward, and accumulating SAND now looks enticing with the recent weaknesses and could bring a good gain in early 2024.
Gold Production And Balance Sheet Details
1 – Quarterly Total Revenues and Trends – Preliminary Revenues were a record of $41.2 million in 3Q23.
SAND Quarterly Revenues History (Fun Trading)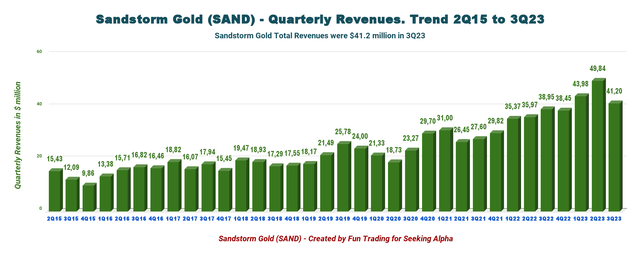
Sandstorm Gold sold approximately 21,100 attributable GEOs and realized preliminary GEOs revenue of $41.2 million in 3Q23, compared with $38.95 million for the comparable period in 2022. Based on 95K GEOs for 2023, SAND will likely meet guidance. SAND produced 73,972 GEOs so far in 2023 (9 months).
The estimated cash costs per attributable ounce have decreased this quarter to about $219 per GEO after applying an operating cash margin of $1,700 per ounce indicated by SAND.
The gold price realized by Sandstorm Gold is estimated at $1,919 per ounce, which is a new record.
SAND Quarterly Gold Price History (Fun Trading)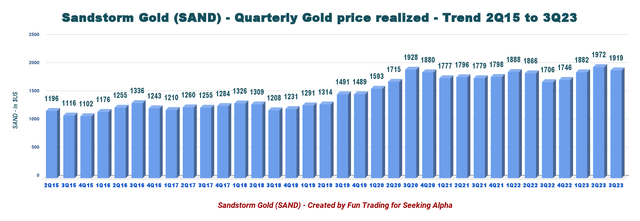
2 – Gold production details – A drop of 3,404 GEOs sequentially
SAND Quarterly GEO Production History (Fun Trading)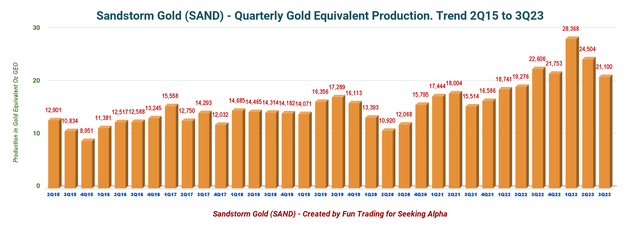
Attributable Gold equivalent ounces sold for the quarter that ended September 30, 2023, were 21,100 ounces, compared with 22,206 ounces for the comparable period in 2022.
Production dropped significantly sequentially. SAND gold equivalent production was 13.9% lower than in the preceding quarter, which is disappointing but still within guidance.
The quarterly cash costs decreased again to $219 per GEO, noticeable progress in 2023 and among the best since 2018, as shown in the chart below.
SAND Quarterly Cash Costs History (Fun Trading)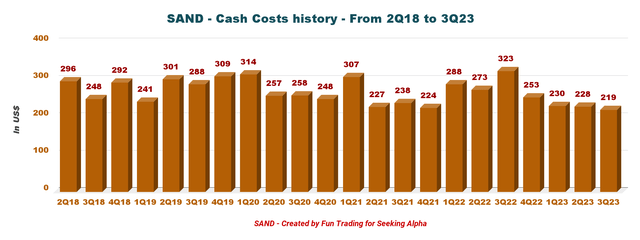
Technical Analysis And Commentary
SAND TA Chart (Fun Trading StockCharts)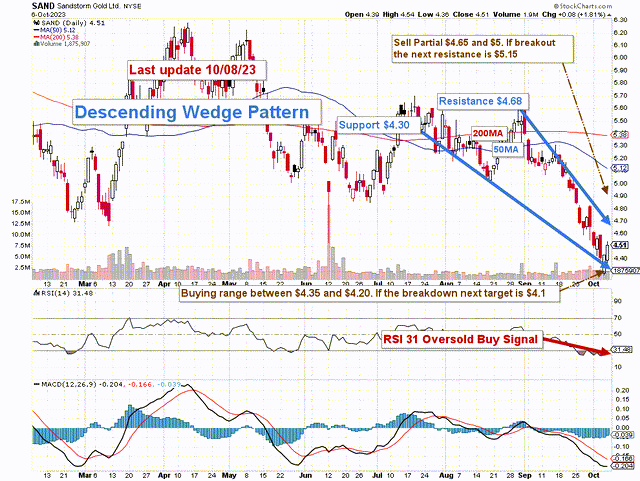
Note: The chart is adjusted from the dividend.
SAND forms a descending or falling wedge pattern, with resistance at $4.68 and support at $4.30. RSI is now 31, which is a buy signal.
The Falling Wedge is a bullish pattern that begins wide at the top and contracts as prices move lower. This price action forms a cone that slopes down as the reaction highs and reaction lows converge.
Thus, the trading strategy is to sell at a resistance range of $4.65 to $5.00 with higher resistance at $5.15, about 50% of your position, and sell another part on any pattern breakout above $6.75. Conversely, I recommend buying SAND between $4.35 and $4.20, with possible lower support at $4.10.
Thus, watch the gold price like a hawk.
Warning: The TA chart must be updated frequently to be relevant. It is what I am doing in my stock tracker. The chart above has a possible validity of about a week. Remember, the TA chart is a tool only to help you adopt the right strategy. It is not a way to foresee the future. No one and nothing can.
Read the full article here