

Introduction
Vancouver-based Sandstorm Gold (NYSE:SAND) released its preliminary 2Q23 production results on July 7, 2023.
Note: This article updates my previous article on Sandstorm Gold, published on June 16, 2023. I have been following SAND’s quarterly results since 2015.
1 – 2Q23 Production and preliminary revenues
- Sandstorm Gold sold approximately 24,500 attributable GEOs and realized preliminary revenue of $49.8 million in 2Q23 (19,276 attributable GEOs and $35.97 million in revenue for the comparable period in 2022).
- The preliminary cost of sales, excluding depletion for the 2Q23 year, was $5.6 million resulting in cash operating margins of approximately $1,743 per attributable gold equivalent ounce ($5.3 million and $1,593 per attributable GEOs for the comparable period in 2022).
- The Company’s gold price in 1Q23 was estimated at $1,879 per ounce.
- Note: Under the renewed NCIB on April 6, 2022, Sandstorm may purchase up to $24.0 million of its common shares, representing approximately 8% of the Company’s issued and outstanding common shares.
SAND bought back shares in 2Q23 and indicated in the press release that:
During the three months ended June 30, 2023, the Company purchased and cancelled approximately 2.6 million Sandstorm common shares at a weighted average price of C$6.92 per share under the Company’s normal course issuer bid.
The chart below makes understanding why management uses cash to buy back shares challenging. Instead, this cash would have been used to reduce debt of $475 million in 1Q23.
SAND Quarterly Cash versus Debt History (Fun Trading)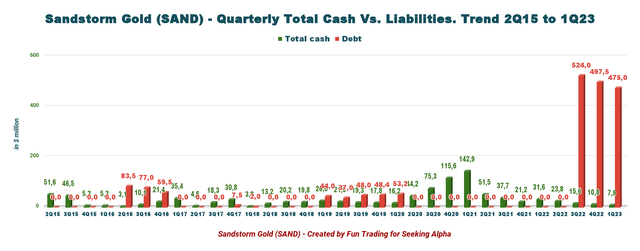
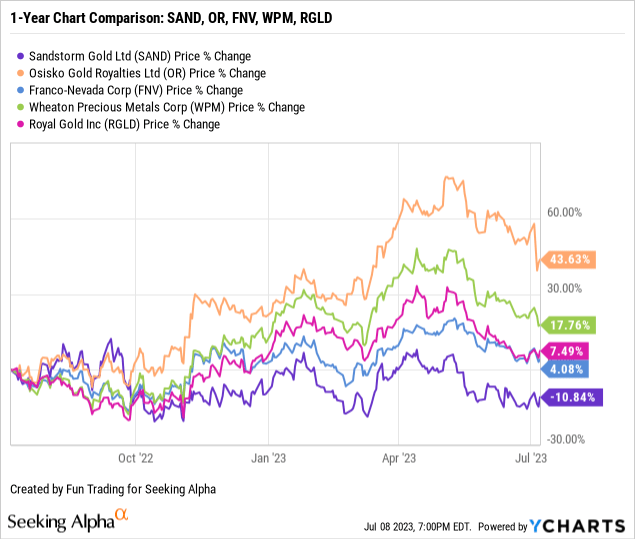
2 – Stock Performance
Sandstorm Gold is still one of the worst performers in this segment and is down nearly 11% on a one-year basis.
3 – Investment Thesis
I consider SAND an outstanding trading tool but it presents limited interest as a long-term investment. My three streamers of choice are Franco-Nevada (FNV), Royal Gold (RGLD), and Wheaton Precious Metals (WPM).
However, I think it is perhaps time to accumulate a small long-term position, and I recommend using the recent weaknesses in gold to accumulate below $5. The company is now paying a dividend yield of 1.14%.
Gold and silver prices are weakening after last month’s Fed pause, signaling that further hikes (potentially two) are still necessary. The June job data is not helping either.
Job gains remain robust, wage growth is still going strong, and unemployment continues to hover near historic lows. That means the job market is still fueling demand in the economy, which the Fed has been trying to slow through rate hikes. And Fed officials have made it clear they think the central bank still has more work to do to bring down inflation, which is still running well above the 2% goal.
SAND 1-Year Chart Gold, Silver, Copper (Fun Trading StockCharts)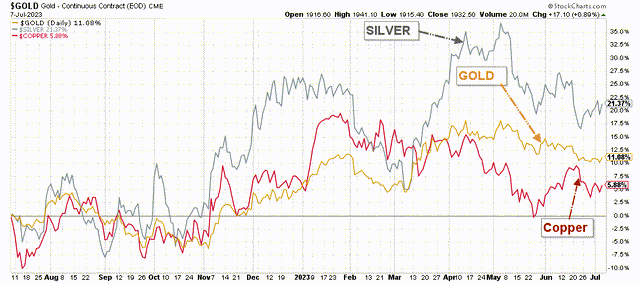
The gold price closed at $1,924 per ounce last Friday, down from $2,050 per ounce in early May. However, the recent drop has been limited, and gold still holds above $1,900 per ounce, providing a solid profit margin for the streamers.
The immediate effect of this volatile situation is that the stock trades in a tight range and cannot find enough strength to break out, which is positive when trading short-term LIFO but disappointing for long-term investors.
Consequently, one working strategy I often suggest, especially for SAND, is trading LIFO a minimum of 50% of your total position and keeping a core long-term position for a much higher payday if the company can succeed in its high-expansion strategy.
Gold Production And Balance Sheet Details
1 – Quarterly Total Revenues and Trends – Preliminary Revenues were a record of $49.8 million in 2Q23.
SAND Quarterly Revenue History (Fun Trading)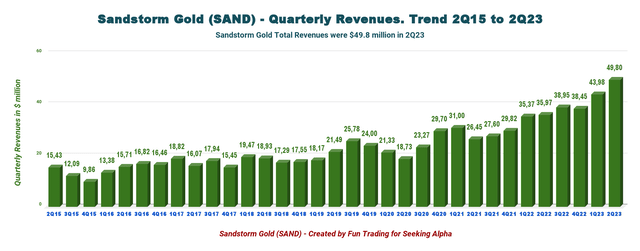
Sandstorm Gold sold approximately 24,500 attributable GEOs and realized preliminary GEOs revenue of $49.8 million in 2Q23, compared with $35.97 million for the comparable period in 2022.
The estimated cash costs per attributable ounce have decreased this quarter to about $229 per GEO after applying an operating cash margin of $1,743 per ounce indicated by SAND. The gold price realized by Sandstorm Gold is estimated at $1,972 per ounce, which is a new record.
SAND Quarterly Gold Price History (Fun Trading)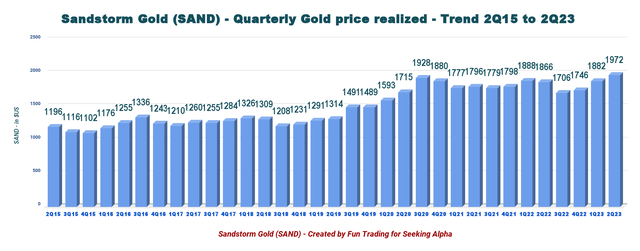
2 – Gold production details – A drop of 3,868 GEOs sequentially
SAND Quarterly Production GEOs History (Fun Trading)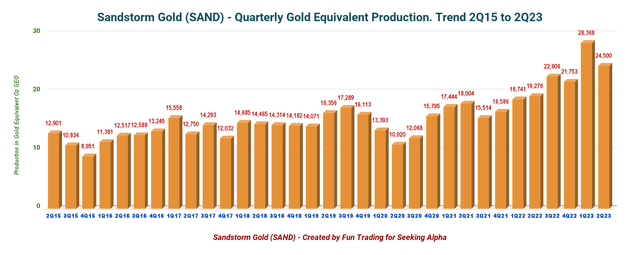
Attributable gold equivalent ounces sold for the quarter that ended June 30, 2023, were 24,500 ounces, compared with 19,276 ounces for the comparable period in 2022.
However, production dropped significantly sequentially. SAND gold equivalent production was 13.6% lower than in the preceding quarter, which is quite disappointing.
The quarterly cash costs decreased again to $229 per GEO, noticeable progress in 2023 and among the best since 2018, as shown in the chart below.
SAND Quarterly Cash Costs History (Fun Trading)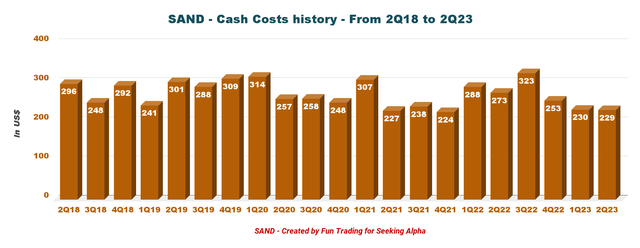
Technical Analysis And Commentary
SAND TA Chart Short-term (Fun Trading StockCharts)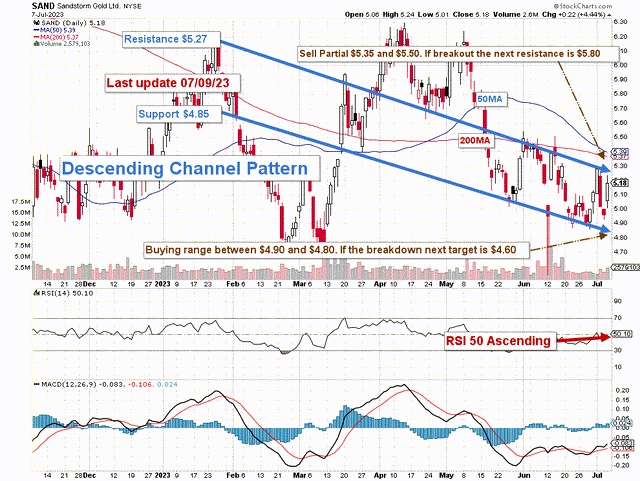
Note: The chart is adjusted from the dividend.
SAND forms a descending channel pattern, with resistance at $5.27 and support at $4.85.
Descending channel patterns are short-term bearish in that a stock moves lower within a descending channel, but they often form within longer-term uptrends as continuation patterns. Higher prices usually follow The descending channel pattern but only after an upside penetration of the upper trend line.
The trading strategy is to sell at a resistance range of $5.35 to $5.50 with higher resistance at $5.80, about 50% of your position, and sell another part on any pattern breakout above $7.
I recommend buying SAND between $4.90 and $4.80, with possible lower support at $4.60.
After declining moderately in late February, gold prices again pierced the $2,000 mark. The surge in the gold price was due to the turmoil in the banking sector after the Silicon Valley Bank collapse, causing investors to seek safe-haven assets.
However, if we look at the gold chart, we see a perfect cup & handle pattern which suggests a pause now with a retracement that I see at $1,850 and $1,825 per ounce before resuming the uptrend. Thus, it is perhaps a good time to take profits and accumulate cash to buy back later.
Thus, watch the gold price like a hawk.
Warning: The TA chart must be updated frequently to be relevant. It is what I am doing in my stock tracker. The chart above has a possible validity of about a week. Remember, the TA chart is a tool only to help you adopt the right strategy. It is not a way to foresee the future. No one and nothing can.
Read the full article here