

Introduction
Vancouver-based Sandstorm Gold Ltd. (SAND) released its third quarter 2023 results on November 6, 2023.
Note: My earlier articles on Sandstorm Gold, which were released on August 14 and October 9, 2023, have been updated in this article. Since 2015, I have been regularly following SAND quarterly results.
With approximately 250 streams and royalties as of September 30, 2023, 39 of the underlying assets in Sandstorm’s portfolio are cash-flowing, and no asset contributes more than 15% to the company’s consensus net asset value.
1–3Q23 Results Snapshot
It was a decent quarter with a significant gold equivalent production of 21,123 Au Eq. Oz (22,606 Au Eq. Oz last year) and revenues of $41.32 million, with $22.50 million in sales and $18.83 million in royalty.
The average GEO price increased this quarter from $1,706 per ounce in 3Q22 to $1,919 per ounce.
The average cash costs for the three months ended September 30, 2023, were $220 per attributable gold equivalent ounce.
Net loss was $0.24 million, or $0.00 per share, in 3Q23, compared to an income of $31.88 million in the comparable quarter a year ago.
SAND Quarterly Gold Equivalent Production per Mine: 2Q23 versus 3Q23
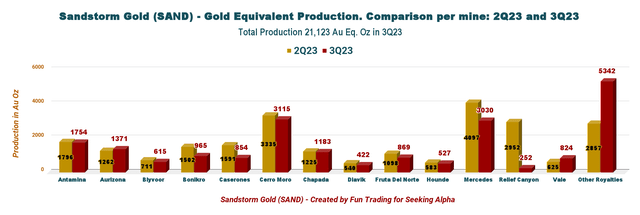
SAND Production per Mine 2Q23 versus 3Q23 (Fun Trading)
As we can see, Cerro Moro, Fruta Del Norte, and Mercedes, among others, were down sequentially.
2: Investment Thesis
Because I disagree with the management’s acquisition approach over the last few years, I have always been reluctant to fully invest in Sandstorm. Although expansion seems great for the company, the stockholders have not benefited much from it.
On the other hand, the stock is now quite attractive, well below $4.6, and I am accumulating. I believe the gold industry is about to turn bullish.
The price of an ounce of gold is currently between $1,950 and $2,020, enabling SAND to generate good free cash flow, but the market is still reluctant to support this sector. Nonetheless, things are improving. The market is waiting for the FED to make it obvious that interest rates will pause early in 2024.
If you’re a new investor looking for opportunities in the streaming and royalty space, starting a medium-term SAND position right now is reasonable. The stock is forming a good support around $4.50, and it is time to accumulate. However, I strongly recommend trading LIFO for about 60% of your entire position.
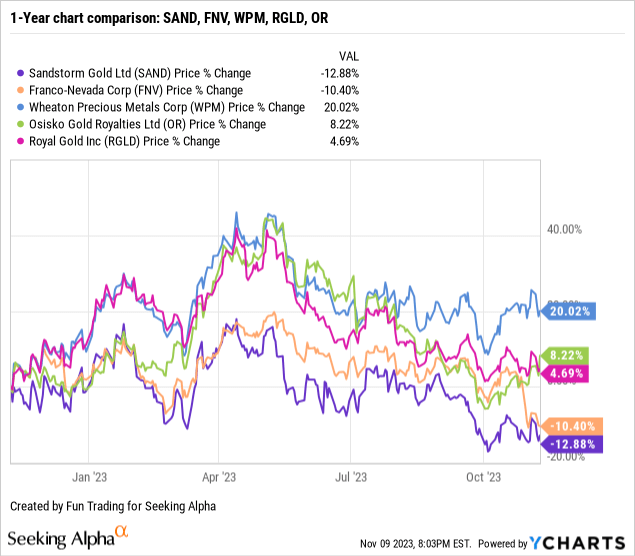
3: Stock Performance: Still lagging its peers.
Sandstorm Gold is still lagging behind its peers and is down 13% on a one-year basis. The market appears unconvinced by SAND’s expansion strategy and is waiting for a fundamental turnaround, which is not happening now.
Sandstorm Gold: Financial Results history Snapshot ending 3Q23: The Raw Numbers
Note: All numbers are in US dollars.
| Sandstorm Gold | 3Q22 | 4Q22 | 1Q23 | 2Q23 | 3Q23 |
| Revenues in dollars | 38.95 | 38.45 | 43.98/53.98* | 49.84 | 41.32 |
| Net Income to shareholders in dollars | 31.68 | -2.36 | 15.67 | 2.05 | -0.24 |
| EBITDA in dollars | 53.02 | 30.36 | 43.77 | 33.30 | 26.62 |
| EPS Diluted | 0.13 | -0.05 | 0.05 | 0.01 | 0.00 |
| Cash From Operating Activities in Millions | 25.09 | 26.27 | 39.92 | 42.14 | 31.95 |
| CAPEX in $million | 489.01 | 88.65 | 3.35 | 11.83 | 2.75 |
| FCF in $million | -463.92 | -62.38 | 36.57 | 30.32 | 29.20 |
| Total cash in $ million (incl. short-term note) | 12.56 | 10.80 | 7.92 | 24.95 | 13.79 |
| Bank Debt in Millions | 524.0 | 497.5 | 475.0 | 467.0 | 456.0 |
| Shares outstanding diluted in millions | 244.75 | 301.28 | 301.26 | 300.67 | 296.17 |
| Dividend per share in $ | 0.015 | 0.015 | 0.015 | 0.015 | 0.015 |
| Production | 3Q22 | 4Q22 | 1Q23 | 2Q23 | 3Q23 |
| In K Au Eq. | 22.61 | 21.75 | 28.37 | 24.50 | 21.12 |
| Gold price | 1,706 | 1,746 | 1,882 | 1,972 | 1,919 |
Source: Company report analysis by Fun Trading (data are available since 2015 only for subscribers).
* $10.0 million in contractual income from stream, royalty, and other interests due to a contractual payment relating to the Mt. Hamilton royalty during the three months ended March 31, 2023.
Part I: Balance Sheet Details
1: Quarterly Revenues and Trends: Total Revenues of $41.324 Million in 3Q23
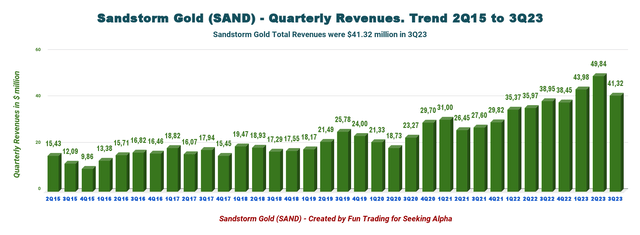
SAND Quarterly Revenue History (Fun Trading)
For the three months that ended on September 30, 2023, Sandstorm Gold reported revenues of $41.32 million, up from $38.95 million during the same period in 2022. The company slightly missed analysts’ expectations.
In comparison to the income of $31.88 million, or $0.13 per diluted share, in the same quarter last year, the net loss in 3Q23 was $0.24 million, or $0.00 per diluted share.
Due to the decrease in cash costs per ounce to $220, the third quarter’s cash operating profits came in at $1,699 per ounce. Excellent improvement this quarter in contrast to 3Q22’s $323 per ounce.
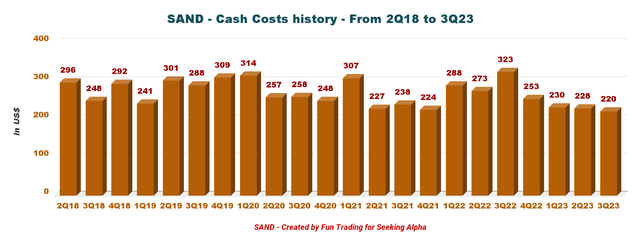
SAND Quarterly Cash Costs History (Fun Trading)
2: Free Cash Flow was $29.20 Million in 3Q23
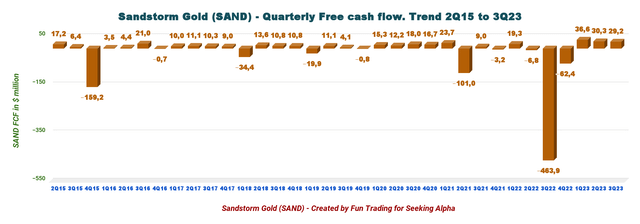
SAND Quarterly Free Cash Flow History (Fun Trading)
Note: Operating cash flow less capital expenditures is known as generic free cash flow.
In the third quarter of 2023, free cash flow was $29.20 million; over the previous 12 months, it was $33.71 million.
The quarterly dividend remains unchanged at $0.015 per share, or a dividend yield of 1.28%.
3: Total shares outstanding and diluted are still high.
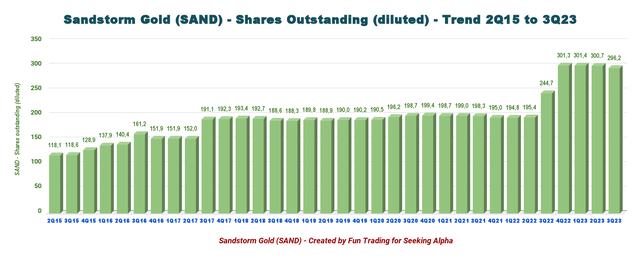
SAND Quarterly Shares Outstanding Diluted History (Fun Trading)
4: The cash position was $13.79 million with a debt of $456 million at the end of September 2023.
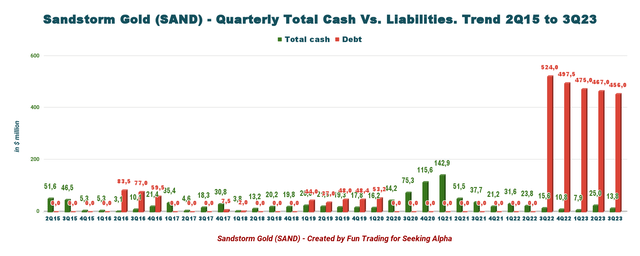
SAND Quarterly Debt versus Cash History (Fun Trading)
The total cash includes the cash and cash equivalent and short-term investments of $13.79 million, while bank debt is now $456 million.
The company expects to repay the debt by 2027 or 2028. However, SAND wrote in the press release:
De-levering the Company’s balance sheet remains a top priority for Sandstorm’s management. To expedite this repayment schedule, the Company is undergoing a process to monetize between $40—$100 million of non-core, non-cash flowing assets by the end of 2024, with proceeds from any sales directed to debt repayment. Accordingly, in October 2023, Sandstorm reached an agreement to sell the El Pilar and Blackwater Royalties for total consideration of $25.0 million comprised of cash and common shares.
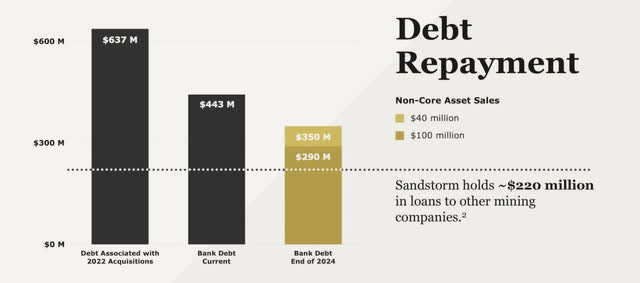
SAND Debt Projection (SAND Presentation)
Furthermore, CEO Nolan Watson said in the conference call:
It’s our goal to get bank debt below $350 million by the end of next year, the combination of cash flow from operations, as well as continued cash from non-core asset sales. We are going to be working on non-core asset sales throughout the remainder of next year.
Part 2: Gold Production Details and 2023 Guidance
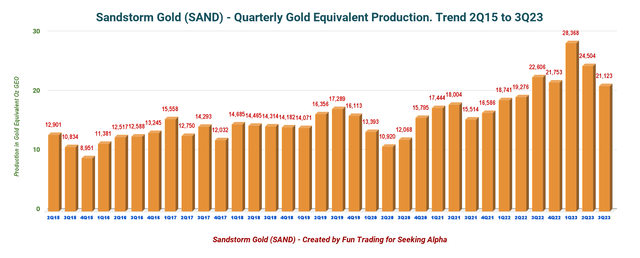
SAND Quarterly Production History (Fun Trading)
Compared to the same quarter a year ago, the total cost of sales decreased to $20.9 million from $25.3 million. The net profit increased to $20.3 million, a 49.6% annual increase. In comparison to the same quarter last year, when the gross margin was 35%, it was 49.4% in the third quarter.
The third-quarter production per mine is shown below:
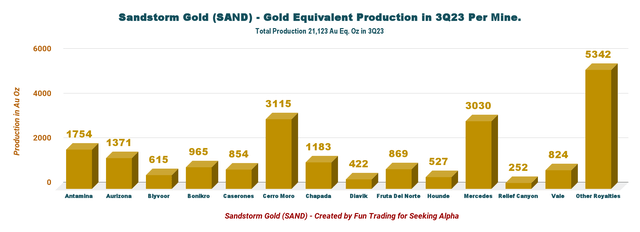
SAND 3Q23 Production per Mine (Fun Trading)
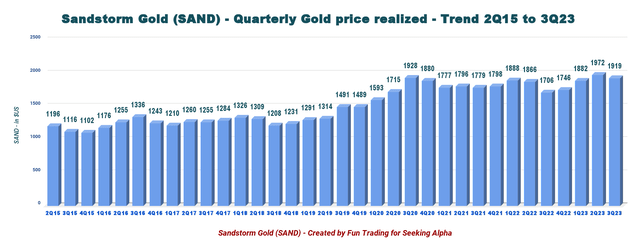
SAND Quarterly Gold Price History (Fun Trading)
2023 Guidance
Sandstorm Gold still expects 90K to 100K GEOs in 2023.
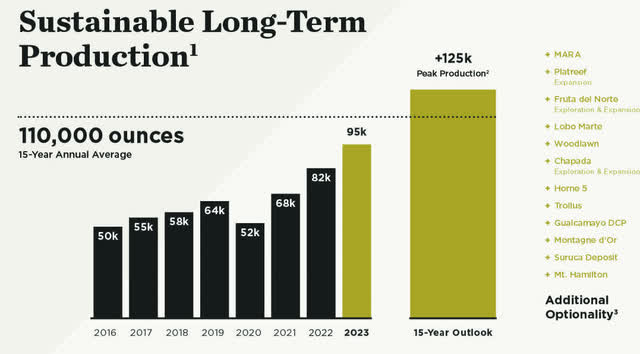
SAND 2023 Guidance (SAND Previous Presentation)
Technical Analysis and Commentary
SAND TA Chart (Fun Trading)
Note: The graph is adjusted for dividends.
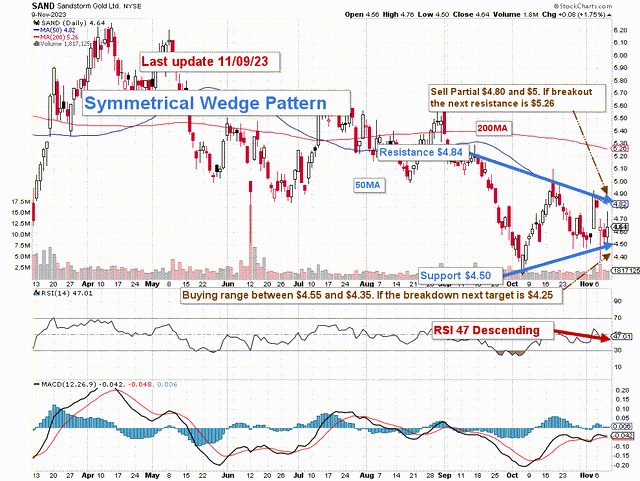
SAND forms a symmetrical wedge/triangle pattern, with resistance at $4.84 and support at $4.50.
The Symmetrical Triangle Chart Pattern indicates an ongoing period of price consolidation before the prices break. A bullish symmetrical triangle is a bullish continuation chart pattern, the movement preceding the triangle’s formation must be bullish. On the other hand, A bearish symmetrical triangle is a bearish continuation chart pattern, the movement preceding the triangle’s formation must be bearish. The symmetrical triangle pattern is different from a descending or ascending triangle pattern as both triangles’ lower and upper trend lines slope towards the centre point.
Maintaining a core long-term position and using roughly 60% to trade LIFO as you wait for your core position to reach a higher target price is the general strategy that I frequently recommend.
Selling SAND in a resistance range of $4.80 to $5, with a higher level of resistance at $5.28, is the trading strategy. On the other hand, it makes sense to buy and accumulate between $4.55 and $4.35, with a possible lower support at $4.25.
Watch gold like a hawk.
Warning: The TA chart must be updated frequently to be relevant. The chart above has a possible validity of about a week. Remember, the TA chart is a tool only to help you adopt the right strategy. It is not a way to foresee the future. No one and nothing can.
Read the full article here