

Today’s article is supposed to provide a second look at the Schwab U.S. Large-Cap Value ETF (NYSEARCA:SCHV), a value factor-focused investment vehicle that I previously covered in July 2021. Back then, I opted for a more conservative Hold rating, mostly owing to the fund’s imperfect strategy, which resulted in its portfolio having too-large exposure to companies with a D+ Quant Valuation grade or worse.
Today, I am not bullish either, as the market environment does not look supportive of a Buy thesis. As the Fed has kept interest rates stable and there have been no CPI surprises that might have fueled bearish bets on longer-duration equities that dominate indices like the S&P 500, a case for value (i.e., high-earnings yield equities) is difficult to construct. So assuming the macro conditions, I believe the factor combination the SCHV portfolio is offering at the moment is unappealing.
What is the basis for SCHV’s investment strategy?
According to the SCHV website, the Dow Jones U.S. Large-Cap Value Total Stock Market Index is the basis for its strategy. In the summary prospectus, it is said that
The index includes the large-cap value portion of the Dow Jones U.S. Total Stock Market Index actually available to investors in the marketplace. The Dow Jones U.S. Large-Cap Value Total Stock Market Index includes the components ranked 1-750 by full market capitalization and that are classified as “value” based on a number of factors. The index is a float-adjusted market capitalization weighted index.
SCHV’s factor mix: high earnings yield, tepid growth, solid quality
As of June 14, there were 501 equities in the SCHV’s portfolio, with Berkshire Hathaway (BRK.B), a conglomerate for which a lengthy introduction is clearly unnecessary, being its key holding with a 3.4% weight, followed by JPMorgan Chase & Co. (JPM), which accounted for 2.6% of the net assets.
Financials, industrials, and healthcare occupy the three key spots. For a broader context, I have added data for the iShares Core S&P 500 ETF (IVV) and the iShares S&P 500 Value ETF (IVE).
Created by the author using data from the ETFs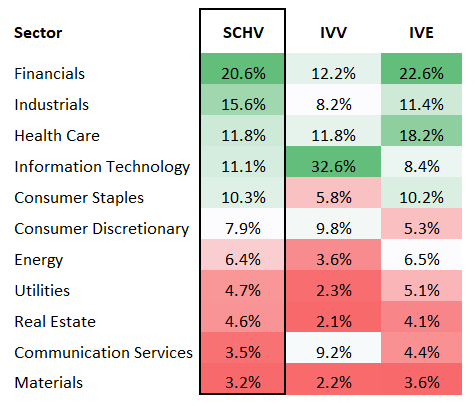
Both IVE and SCHV have fairly standard sector proportions to be expected from value-centered vehicles. In contrast to the growthier IVV, they are meaningfully underweight in information technology. At the same time, high-EY sectors like financials have a significant impact on their performance. However, it is a bit strange to see energy allocations only in single digits, as the sector tend to trade at a substantial discount to the market. For example, according to the Energy Select Sector SPDR Fund ETF’s (XLE) website, the Energy Select Sector Index, which tracks the energy players taken from the S&P 500, has a Price/Earnings ratio of just 12.63x. Moreover, my calculations show the median P/E for the energy sector portion of SCHV’s portfolio at around 12.1x. Nevertheless, while the mid-single-digit weight of this low-P/E sector is counterintuitive, there is a plausible explanation for that, and this is the market-cap-based weighting schema. For that reason, SCHV has about 51.6% allocated to mega-caps, and in that group, there are just three energy companies, namely Exxon Mobil (XOM), Chevron (CVX), and ConocoPhillips (COP), together accounting for only 4.1% of the net assets, while there are 12 mega-cap financials.
Anyway, does SCHV deliver on the value front? It mostly does, but precisely like almost three years ago, I believe there is something to criticize.
- Value-oriented market-cap-weighted portfolios with sizable footprint in the bellwether league typically have small exposure to stocks with a B- Quant Valuation rating or better. In most cases, the quality premia is to blame. This issue has not gone anywhere, as a meaningful portion of SCHV’s portfolio is clearly too generously priced, as comes for its over 60% allocation to names that have that grade at D+ or worse. It is necessary to note that in the cohort of the top ten (18.7% weight), there are seven such companies.
- At the same time, when it comes to the earnings yield, the portfolio does look cheaper than, for example, the S&P 500, with its weighted-average adjusted EY (negative figures were removed) at 5.19%, as per my calculations. The S&P 500 index currently has an EY of approximately 3.76%.
- Assuming no exposure to NVIDIA (NVDA), which has one of the highest Price/Sales ratios in the S&P 500, SCHV’s P/S is at 3.6x. I concur that this does not look cheap. However, to contextualize, when I discussed the Schwab U.S. Large-Cap Growth ETF (SCHG) a few days ago, its P/S stood at around 11.1x.
Growth
In most cases, a comparatively high earnings yield (hence, a lower P/E) correlates with a weak forward EPS growth rate. The same logic works for the P/S ratio and the forward revenue growth rate. This is true in the case of SCHV. For example, I have found out that its portfolio has just a 5.2% weighted-average forward earnings growth rate, as over a quarter of holdings will likely see their EPS contract, as per pundits’ estimates. A similarly bleak picture is observed when it comes to EBITDA growth, with the weighted-average growth rate at just 4.6%, as the culprit is similar: there are too many companies (20.7%) that will likely be incapable of delivering even a modest improvement in EBITDA. Holdings with a negative forward revenue growth rate have almost the same weight, but the weighted average figure is even lower, at 3.8%, as per my calculations.
Quality
With the bulk of the net assets allocated to the bellwethers, SCHV offers a quality story that is mostly solid. Yet vulnerabilities do exist.
- Over 89% of the holdings have a B- Quant Profitability rating or higher, a robust result for a portfolio with a $168.7 billion weighted-average market cap.
- Loss-making companies have only 5% weight.
- Adjusted ROE is approaching 19%, which is a bit below 20%, a level I consider desirable. To adjust the ROE, I have removed all the negative figures as well as those above 100%, as their reliability is questionable assuming a high level of debt that reduces shareholder equity and thus pushes the ROE higher even in case profits are bleak.
- At the same time, financials-heavy SCHV does not offer much in terms of Return on Assets, with that metric at just 6.8%, which is below the 10% level that I believe is optimal.
SCHV’s past performance
SCHV has a common value ETF issue: over periods long enough, it captures less downside than the S&P 500 or the S&P 500-tracking ETFs, but it lags badly when it comes to upside capture. To corroborate, below is the performance data for SCHV, IVE, and IVV. The latter was selected as a benchmark. The period assessed is January 2010–May 2024.
| Metric | SCHV | IVV | IVE |
| Start Balance | $10,000 | $10,000 | $10,000 |
| End Balance | $43,436 | $62,197 | $47,999 |
| CAGR | 10.72% | 13.52% | 11.49% |
| Standard Deviation | 14.43% | 14.75% | 15.01% |
| Best Year | 31.03% | 32.30% | 31.63% |
| Worst Year | -7.63% | -18.16% | -9.19% |
| Maximum Drawdown | -25.64% | -23.93% | -25.35% |
| Sharpe Ratio | 0.71 | 0.87 | 0.73 |
| Sortino Ratio | 1.1 | 1.38 | 1.16 |
| Benchmark Correlation | 0.96 | 1 | 0.95 |
| Upside Capture | 88.42% | 100% | 93.32% |
| Downside Capture | 96.9% | 100% | 99.99% |
| 2022 return | -7.63% | -18.16% | -5.4% |
Data from Portfolio Visualizer
Over that period, SCHV underperformed both IVV and IVE. A bit more comfortable standard deviation was a silver lining. However, its risk-adjusted returns (Sharpe and Sortino ratios) were the weakest. I suppose the most important part here is that SCHV had the deepest maximum drawdown (March 2020) in the group, despite its downside capture being the lowest. Also, it was unable to capture sufficient upside during the bullish periods, and its inability to beat IVV primarily stemmed from that.
Final thoughts
SCHV has an impressive AUM of $10.74 billion and a trading history dating back to 2009. Its paper-thin expense ratio of 4 bps is also worth appreciating, as investors can be confident that a significant share of gains will not disappear in the long term due to burdensome fees eating into it. However, as interest rates remain unchanged and there is some progress on the disinflation front, SCHV does not look poised to outmaneuver the market in the near term. I like its quality proposition, mainly its allocation to levered FCF-positive companies (about 78% weight), yet this alone is, of course, anything but enough to assign a Buy rating to this vehicle.
Read the full article here