Hotel REITs have been the 5th-best REIT sector for total return this year, posting a gain of 9.35%, keeping pace with the Dow (+9.23%) and outstripping the S&P 400 (+7.88%) and S&P 600 (+5.67%), while badly lagging the red-hot Nasdaq (+45.44%) and the S&P 500 (+19.39%).
Hoya Capital Income Builder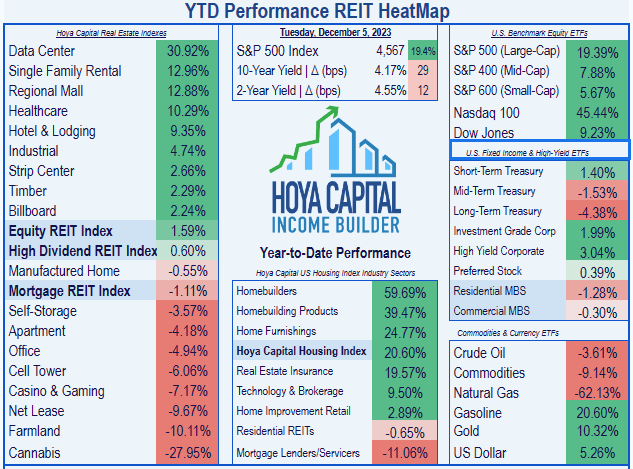
Hotel REITs posted perhaps the strongest showing of any REIT sector during Q3 earnings season. All 5 of the Hotel REITs that provide FFO guidance raised that guidance.
Hoya Capital Income Builder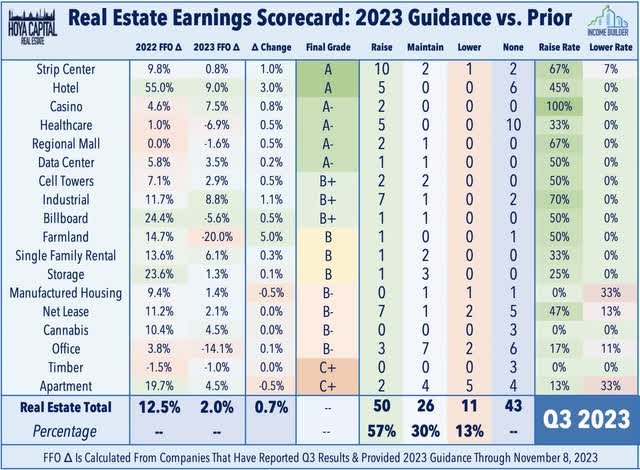
Hotel demand is closely related to travel volume. TSA Checkpoint data shows passenger volume remains slightly up from pre-pandemic levels. Meanwhile, STR reports that industry-wide, hotel Revenue Per Available Room (“RevPAR”) was 17% above 2019 levels in October. This reflected an increase of roughly 21% in Average Daily Room Rates (“ADR”), offset by a drag of about 3% in average occupancy rates.
Hoya Capital Income Builder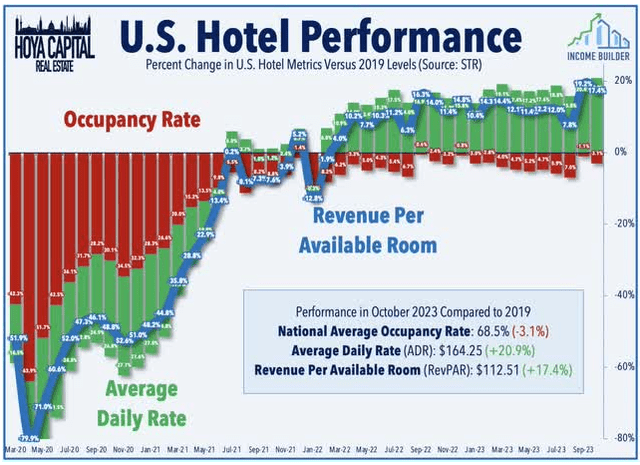
The uptick in travel is not benefitting all hotels equally, however. As Hoya Capital recently noted:
Remote work is changing the complexion of business demand, but not necessarily to the detriment of the hotel industry. The “traveling salesman” visits are being replaced by more frequent group events while “work-from-anywhere” hybrid work-leisure trips are skewing demand towards more “destination” segments . . . We favor the higher-margin limited-service segment and select full-service names with a “destination” focus.
Meanwhile Net Lease REITs were among the poorer performers in Q3 earnings season, ranking 14th out of 18 REIT sectors. But the Net Lease sector graded out at a decent B-, as 7 of the 10 companies that provide FFO guidance raised that guidance, compared to 2 that lowered. Net Lease REITs were hampered by cap-rate compression in acquisitions, but buoyed by strong performance from their retail clients.
This article will examine a company whose assets are split almost evenly between Hotel and Net Lease properties.
Meet the company
Service Properties Trust
Headquartered in Newton, Massachusetts, and externally managed by RMR Group, Service Properties Trust (NASDAQ:SVC) was founded in 1995. Twenty-eight years later, it is still a small-cap ($1.25 billion).
The company owns and operates 221 hotels (about 38,000 rooms), representing an investment of $6.2 billion, as well as 761 retail sites (13.4 million rentable square feet), for an investment of $5.1 billion.
SVC Investor Presentation, November 2023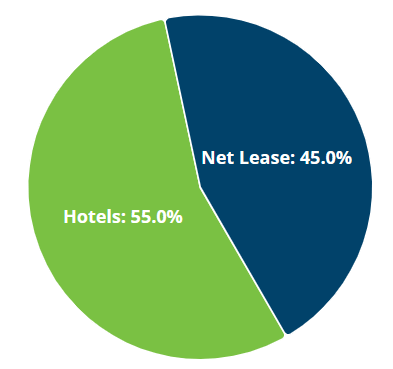
SVC assets are spread across 46 U.S. states, as well as Washington, DC, Puerto Rico, and Canada. However, more than half of the company’s assets, in both hotels and net lease retail, are concentrated in the top 10 states:
- California,
- Texas,
- Illinois,
- Florida,
- Georgia,
- Arizona,
- Ohio,
- Louisiana,
- Pennsylvania, and
- Missouri
SVC Investor presentation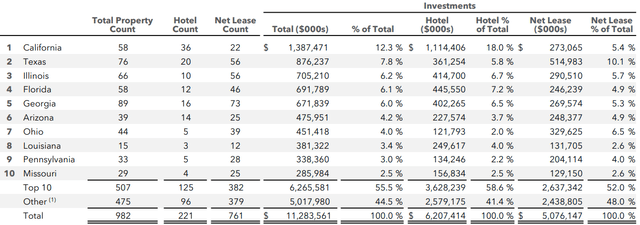
Hotel portfolio
About 40% of SVC’s hotels are full service operations, and another 37% extended stay, leaving only 23% in the limited-service category that Hoya Capital favors for the near future.
SVC Investor Presentation, November 2023
And only 7% are clearly “destination” hotels, although some of the urban properties might also be considered as such. Nearly half are in the suburbs, and another 18% are near airports.
SVC Investor Presentation, November 2023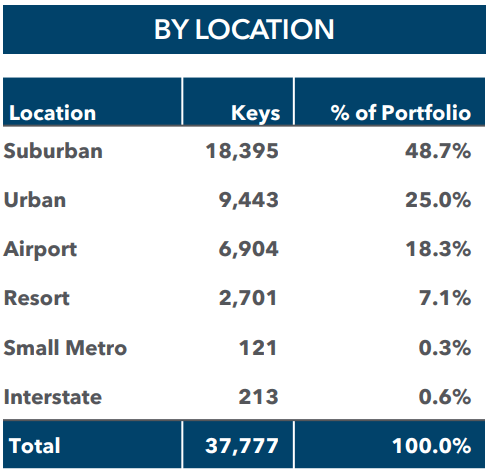
According to management, over 60% of SVC’s hotels are upscale or “upper upscale”, with only 38.5% in the midscale range.
SVC Investor Presentation, November 2023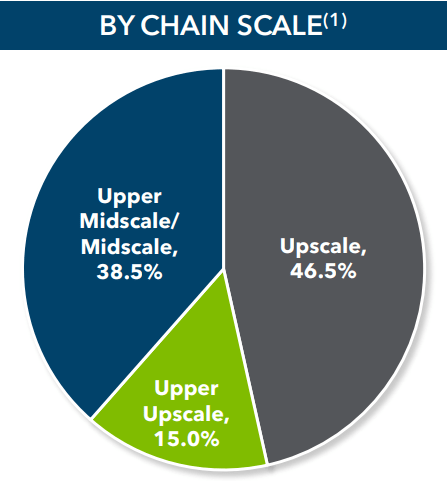
Occupancy has ranged from 50% during December and January to as high as 71% in June, averaging an unimpressive 63.6% over the past 15 months.
SVC Investor Presentation, November 2023
EBITDA generated by the Full-service segment rose 7.7% YoY (year over year) to $42 million in Q3, generating an EBITDA margin of 18.9%, slightly up from 2022.
The Extended Stay segment EBITDA fell 11.1% to $24 million, generating EBITDA margin of 22.8%, down 230 basis points from 2022.
Meanwhile, the Select Service segment EBITDA fell 8.3% to $11 million, generating a margin of 17.3%, down from 18.9% YoY.
SVC Investor Presentation, November 2023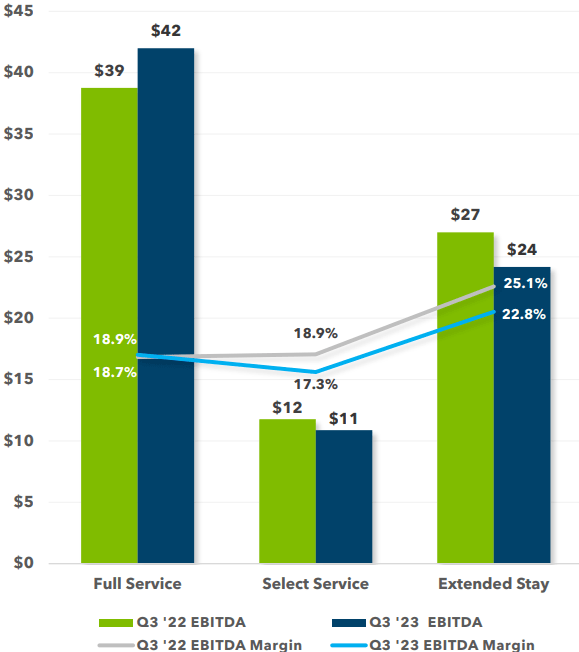
All 5 of SVC’s top EBITDA generators on the Hotel side of the business were Sonestas.
SVC Investor Presentation, November 2023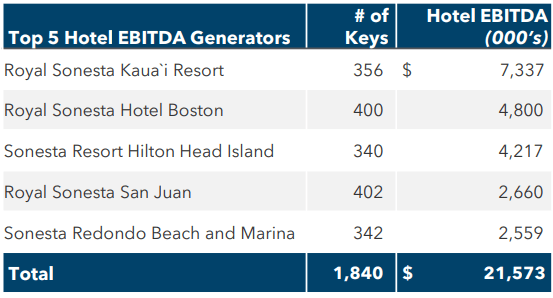
SVC owns 34% of Sonesta, which is the 8th-largest hotel chain in the world, and includes several well-known brands, including Red Lion and America’s Best Value.
SVC Investor Presentation, November 2023
Net Lease Portfolio
On the Net Lease side of the business, the company’s 761 properties generate an ABR (annual base rent) of $374 million, with a weighted average lease term of 9.1 years. The portfolio is 95.8% occupied, and rent coverage stands at 2.72.
SVC Investor Presentation, November 2023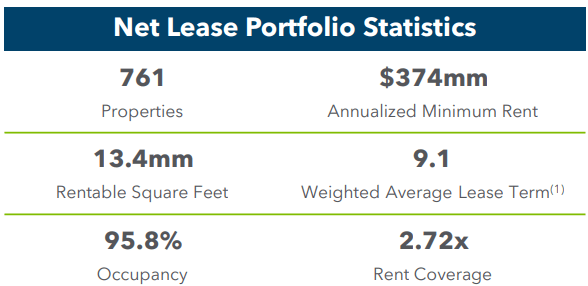
The net lease portfolio stretches across 43 U.S. states, leaving out only Montana, South Dakota, Delaware, Rhode Island, Massachusetts, Vermont, and Maine. The heaviest concentrations are in:
- Texas,
- California,
- Illinois,
- Ohio, and
- Georgia
SVC Investor Presentation, November 2023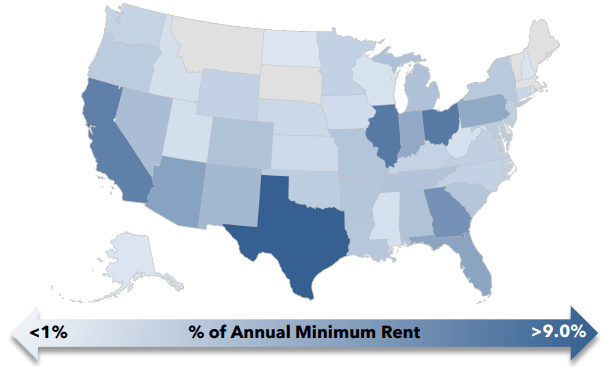
followed by:
- Arizona, Pennsylvania
- Indiana, and
- Florida.
SVC’s net lease tenants are diversified across 21 industries and 135 brands.
SVC Investor Presentation, November 2023
That looks fairly impressive at first blush, but by industry, SVC depends heavily on travel centers, which contribute 68.6% of ABR. All other categories are small by comparison.
SVC Investor Presentation, November 2023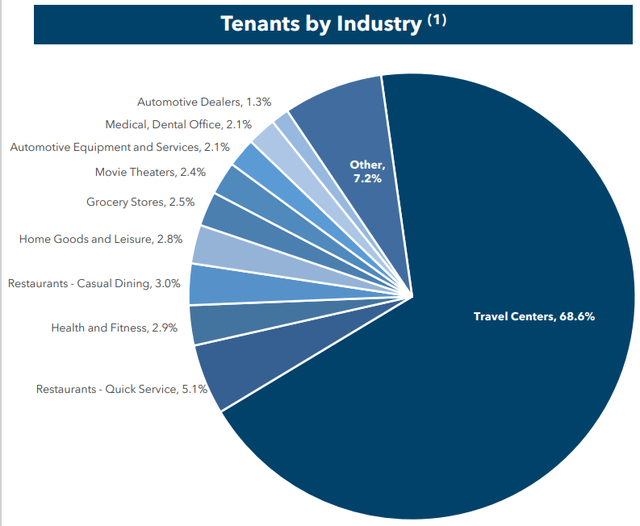
Tenant diversification by company is far from ideal, with one customer (TravelCenters of America) contributing over two-thirds of SVC’s rental revenue.
SVC Investor Presentation, November 2023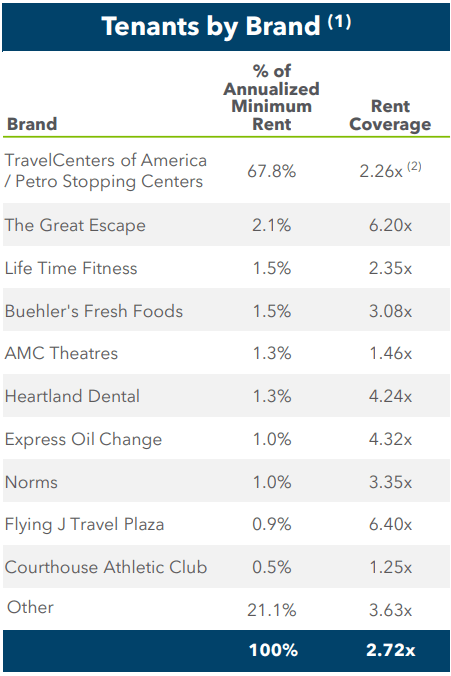
This crucial tenant operates 176 travel centers, operating under two brands, in difficult-to-replicate locations along U.S. interstate highways. SVC has 5 master triple net leases with Travel Centers of America, that run through 2033, with 50 years of extension options, and rents are guaranteed by BP Corporation of North America.
A full 97% of SVC’s net leases currently deployed have contractual increases built in, with 13% of these pegged to the consumer price index.
SVC Investor Presentation, November 2023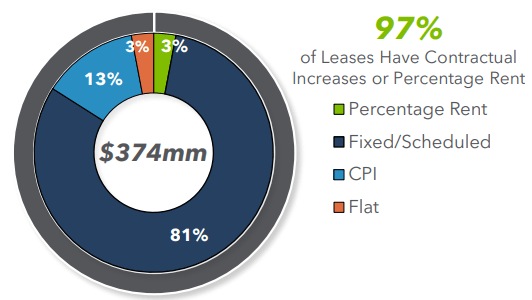
Perhaps the most impressive thing about the net lease portfolio is the expiration schedule, which shows not more than 3.3% of ABR expiring in any single year over the next 10.
SVC Investor Presentation, November 2023
Quarterly Results
Q3 results for SVC were messy. The company operated at a quarterly loss, but for the first 9 months of 2023, net income was positive, at $10.5 million. Q3 FFO rose by 3.8% YoY, and through the first 9 months, showed a 29.8% improvement YoY, mostly because of easy comparables, following the disaster of early 2022. FFO per share showed a similar pattern to FFO. Meanwhile, the company’s EBITDA for Q3 was down (-12.7)% from the previous year, but up 17.8% for the first 9 months. And the company has held share count steady, so is not diluting shareholder value in an attempt to escape its troubles.
| Q3 | Q3 | YTD | YTD | ||||
| Metric | 2023 | 2022 | % Change | 2023 | 2022 | % Change | |
| Net Income | (-$4128) | $7500 | NA | $10,544 | (-$100,972) | NA | |
| FFO | $91,731 | $88,397 | 3.8% | $221,376 | $170,597 | 29.8% | |
| FFO/share | $0.56 | $0.54 | 3.7% | $1.34 | $1.04 | 28.8% | |
| EBITDA | $170,408 | $195,267 | (-12.7)% | $520,394 | $441,663 | 17.8% | |
| Average Shares | 165,027 | 164,745 | 0.02% | 164,933 | 164,697 | 0.01% |
Source: SVC Investor Presentation, November 2023
Growth metrics
Here are the 3-year growth figures for FFO (funds from operations), and TCFO (total cash from operations). Like most REITs, SVC’s revenues took a ferocious beating during the COVID crisis, but unlike most, SVC’s recovery has been very slow. FFO levels today are less than half where they stood in 2019., averaging an appalling (-16.5)% slippage per annum.
| Metric | 2019 | 2020 | 2021 | 2022 | 2023* | 4-year CAGR |
| FFO (millions) | $608 | $221 | $(-11.5) | $244 | $295 | — |
| FFO Growth % | — | (-63.7) | NA | NA | 20.9 | (-16.5)% |
| FFO per share | $3.78 | $1.23 | $1.50 | $1.72 | $1.72 | — |
| FFO / share growth % | — | (-67.5) | 22.0 | 14.7 | 0.0 | (-16.7)% |
| TCFO (millions) | $260 | (-$311) | (-$544) | (-$132) | (-$21) | — |
| TCFO Growth % | — | NA | NA | NA | NA | NA |
* estimate, based on Q3 results
Source: Seeking Alpha Premium, Hoya Capital Income Builder, and author calculations
The Bloomberg analyst consensus 2024 forecast calls for FFO per share of $1.78, which would represent mediocre growth of 3.5%.
InsiderCow.com shows no insider buys or sells over the past 12 months. SVC’s return on equity over the past 12 months has been (-1.52)%, while the company has grown its assets by a negligible 1.5%.
Meanwhile, here is how the stock price has done over the past 3 twelve-month periods, compared to the REIT average as represented by the Vanguard Real Estate ETF (VNQ).
| Metric | 2020 | 2021 | 2022 | 2023 | 3-yr CAGR |
| SVC share price Dec. 6 | $13.51 | $8.54 | $7.43 | $7.63 | — |
| SVC share price Gain % | — | (-36.8) | (-13.0) | 2.7 | (-13.3) |
| VNQ share price Dec. 6 | $86.42 | $109.66 | $85.22 | $83.54 | — |
| VNQ share price Gain % | — | 26.9 | (-22.3) | (-2.0) | (-0.84) |
Source: MarketWatch.com and author calculations
While the VNQ bounced back strongly from the pandemic in 2021, with a gain of 27%, SVC shares continued to plummet, shedding another (-37)% of their value. The company outperformed the VNQ last year, losing only (-13)%, compared to the VNQ’s (-22)%. This year, SVC is up a little at +2.7%, while VNQ is down a little, at (-2.0)%. But as a 3-year investment proposition, SVC has vastly underperformed the VNQ, losing an annual average of (-13.3)%, while the VNQ has been essentially flat at (-0.84)%.
Balance sheet metrics
SVC management assures investors in its November presentation that they have a “Strong balance sheet.” Here are the cold, hard facts.
| Company | Liquidity Ratio | Debt Ratio | Debt/EBITDA | Bond Rating |
| SVC | 1.21 | 83% | 9.0 | B+ |
| Hotel REIT avg | 1.81 | 42% | 6.4 | — |
| Net Lease REIT avg | 2.12 | 34% | 6.2 | — |
| Overall REIT avg | 1.91 | 30% | 6.3 | — |
Source: Hoya Capital Income Builder, Seeking Alpha Premium, and author calculations
Though bond-rated, SVC’s liquidity ratio of 1.21 and debt ratio of 83% are abysmal, and the 9.0 Debt/EBITDA ratio casts doubt on the company’s ability to grow its way out of this hole.
SVC has long-term debts totaling $5.7 billion, over against $418 million in cash and equivalents, and $650 million available on their revolver. All the debts are held at interest rates exceeding 5.0%. The WAIR (weighted average interest rate) computes to approximately 5.95%, as follows:
| Type of Debt | Principal | Int. Rate | Interest |
| Unsecured fixed-rate senior notes | $4.0 bn | 5.33% | $213.2 mn |
| Secured fixed-rate senior notes | $1.0 bn | 8.625% | $ 86.25 mn |
| Secured fixed-rate mortgage notes | $0.601 bn | 5.60% | $ 33.9 mn |
| Debt Total and Weighted Average Interest | $5.6 bn | 5.95% | $333.3 mn |
This is by far the highest WAIR of any company I have reviewed for Seeking Alpha.
A look at the maturity schedule shows the company has negligible payments in 2024, but that is mostly because they issued $1 billion worth of senior secured notes at a blistering 8.625%, to cover the 2024 maturities. Borrowing at higher interest, to pay off near-term obligations is a troubling sign. Interest expense will cut significantly into FFO for the foreseeable future.
Even so, a formidable 20% of their debt still comes due in 2025.
SVC Investor Presentation, November 2023
Dividend metrics
SVC’s greatest appeal to the investor is its 10.5% dividend yield. Yet, when you factor in the fact that the company slashed the dividend from $0.54 to a mere penny during the pandemic, and has since restored it only to $0.20, SVC ends up paying about what you would expect for a Hotel/Net Lease hybrid REIT, over the coming 3 years.
| Company | Div. Yield | 5-yr Div. Growth | Div. Score | Payout | Div. Safety |
| SVC | 10.5% | (-17.7)% | 5.85 | 50% | D |
| Hotel REIT avg | 5.8% | (-5.4)% | 4.91 | 51% | C |
| Net Lease avg | 6.0% | 2.6% | 6.48 | 78% | C |
| REITs overall | 3.9% | 5.0% | 4.51 | 66% | C |
Source: Hoya Capital Income Builder, TD Ameritrade, Seeking Alpha Premium
Dividend Score projects the Yield three years from now, on shares bought today, assuming the Dividend Growth rate remains unchanged.
However, that juicy 10% yield will only continue to be enjoyed as long as the company does not cut the dividend. Unfortunately, owing to SVC’s indebtedness problems and revenue struggles as seen above, there is a tangible risk that the dividend may be cut in the coming 12 months.
Valuation metrics
SVC is dirt cheap at 4.4x FFO ’23, and it trades at a very steep (-36.4)% discount to NAV, but that doesn’t make it a bargain. In my opinion, SVC is cheap for a reason, and research by Hoya Capital indicates that cheap REITs tend to stay cheap.
| Company | Div. Score | Price/FFO ’23 | Premium to NAV |
| SVC | 5.85 | 4.4 | (-36.4)% |
| Hotel REIT average | 4.91 | 9.4 | (-21.3)% |
| Net Lease REIT average | 6.48 | 13.3 | (-5.0)% |
| Overall REIT average | 4.51 | 17.0 | (-18.0)% |
Source: Hoya Capital Income Builder, TD Ameritrade, and author calculations
What could go wrong?
SVC is heavily dependent on one tenant. As Travel Centers of America goes, so goes SVC. If unexpected reversals should occur for this one underlying business, the consequences to SVC could be as bad or worse.
SVC is externally management by RMR Group. The interests of RMR Group may at times conflict with the interests of SVC and its shareholders. The graphic below gives more details on that relationship.
SVC Investor Presentation, November 2023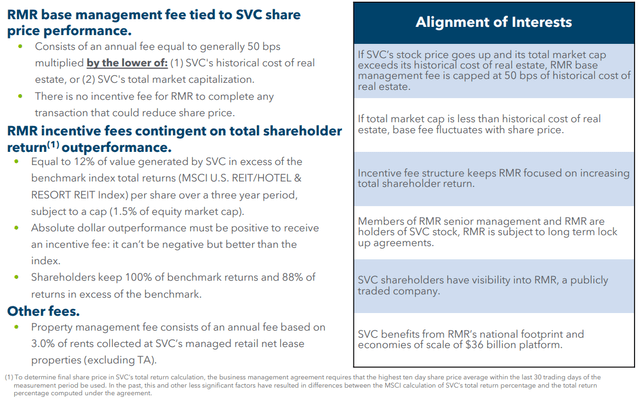
There is palpable risk of a dividend cut, which would leave SVC investors with the worst of both worlds: reduced cash income and a sharp drop in share price.
Investor’s bottom line
Service Properties is a potential yield trap. With high indebtedness and struggles on the revenue side of the picture, the ultra-high 10.5% yield does not look at all safe, and thus the risk of a drop in share price that more than offsets the yield is unmistakable. I cannot recommend buying shares in this company, and if I were holding shares, I would strongly consider reallocating that capital elsewhere. There are many better investments than this company right now. I rate SVC a Sell.
Seeking Alpha Premium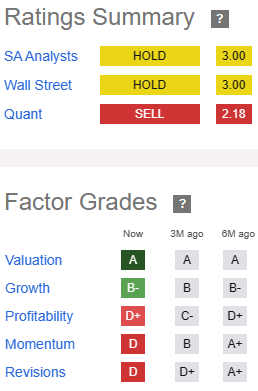
I am not alone in that opinion. The Seeking Alpha Quant Ratings system also rates SVC a Sell, as does Zacks, and one of the 4 Wall Street analysts covering the firm. The average analyst price target for SVC is $8.83, implying 15.7% upside.
However, as always, the opinion that matters most is yours. Because it’s your money.
Read the full article here


