

Introduction
As the name suggests, the Invesco S&P 500® Quality ETF (NYSEARCA:SPHQ) is a product that serves as a subset of the S&P 500 (SP500). It focuses on large-cap stocks that are perceived to be high-quality, or to be more specific, score highly regarding a composite quality score (as determined by S&P Dow Jones Indices).
There is, of course, no standardized definition of “quality,” and certain metrics that are believed to be apt proxies of quality for Investment Manager A, may not even be considered by Investment Manager B during the stock selection process; in light of this, gauging SPHQ’s merits may come across as a tricky proposition, particularly when one considers the plethora of quality alternatives that are out there in the market.
How Does SPHQ Compare To The Most Popular Quality ETF: QUAL?
To ascertain if SPHQ is a worthwhile product, we thought it would be appropriate to see how it stacks up against the most popular quality factor product in the market, namely, iShares MSCI USA Quality Factor ETF (QUAL).
Firstly, note that even though QUAL made its debut in the markets, almost 8 years after SPHQ, it has still managed to garner an assets-under-management (“AUM”) figure ($44bn) which is almost 5x as much as our focus ETF. We must reiterate that we find QUAL’s popularity rather intriguing, as we don’t see any major edge that it offers, other than slightly better trading spreads (this is no surprise given a higher daily dollar volume figure that is 4.5x that of SPHQ’s corresponding figure).
As far as the cost efficiency is concerned, both products are available at an expense ratio of 0.15%, and even though QUAL is a little more stable than SPHQ in terms of its annual churn (only a 800bps difference), the turnover ratio of both products is on the higher side (the median annual turnover rate for ETFs is 29%).
Note also that SPHQ has been a little more generous with its distributions recently (3-year CAGR of almost 8% as opposed to just a little over 1.3% for QUAL).
Both products use largely similar screening mechanisms whilst arriving at the final portfolio – with one major differentiating sub-factor. Both products focus on stocks that score highly on the ROE front (TTM EPS as a function of the latest book value per share), and low leverage front (low debt to book value as per the latest fiscal). However, QUAL also uses an earnings variability gauge as a proxy of quality, whereby the standard deviation of EPS growth over 5 years is determined. SPHQ does not go down this route, but rather focuses on the level of accruals on the balance sheet relative to total operating assets. A high degree of accruals, doesn’t reflect well on the quality of cash flow and can be useful in weeding out companies that tend to strike a disingenuous portrait of financial health.
Now, some investors may be enthused by QUAL’s desire to cover a larger pool of stocks (130 quality stocks as opposed to 102 stocks for SPHQ) with some meaningful exposure to even mid-caps (a 20% mid-cap stake vs just 11% for QUAL), but the results so far have shown that this doesn’t necessarily translate to better risk-adjusted returns.
Seeking Alpha, ETF Prospectuses YCharts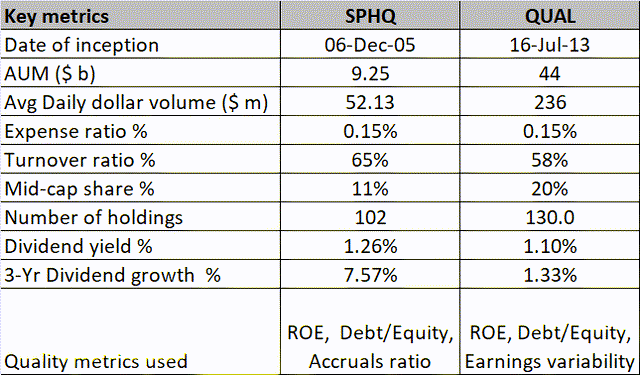
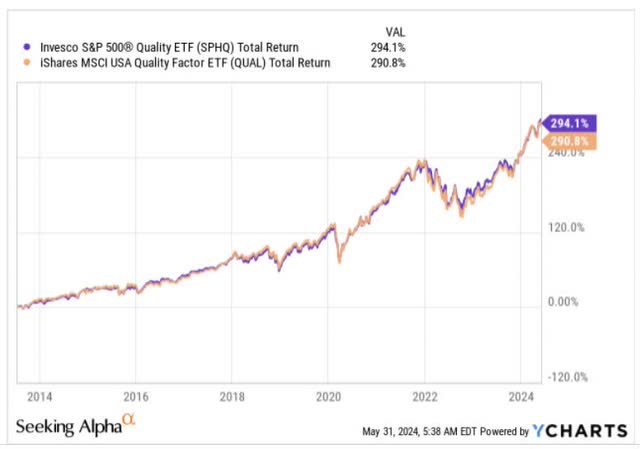
On a total return basis, there is not a lot to split these two products since QUAL came to the bourses in 2013. However, if you incorporate the degree of risk involved in generating those returns, we get a different picture.
Firstly note the long-term and short-term Sharpe ratios of both products, where the standard deviation is brought into consideration, and the ability to generate superior excess returns (over the risk-free rate) is ascertained. Note that SPHQ throws up better Sharpe ratio readings, both over a 10-year time frame and a 3-year time frame.
YCharts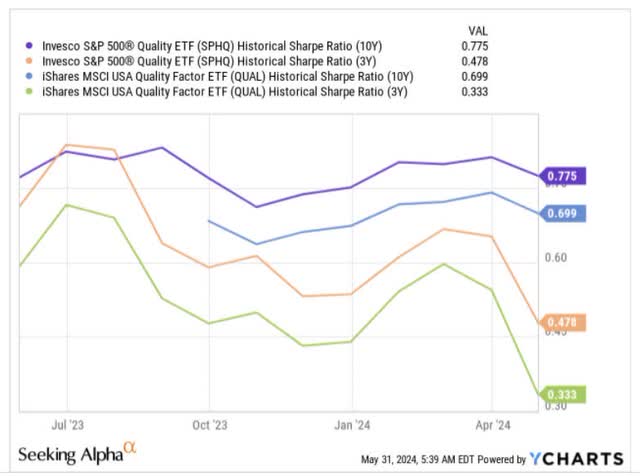
Likewise, if one only gauges the excess return track record given the degree of downside deviation involved (as measured by the Sortino ratios), even then, SPHQ comes out on top, regardless of the time frame in question.
YCharts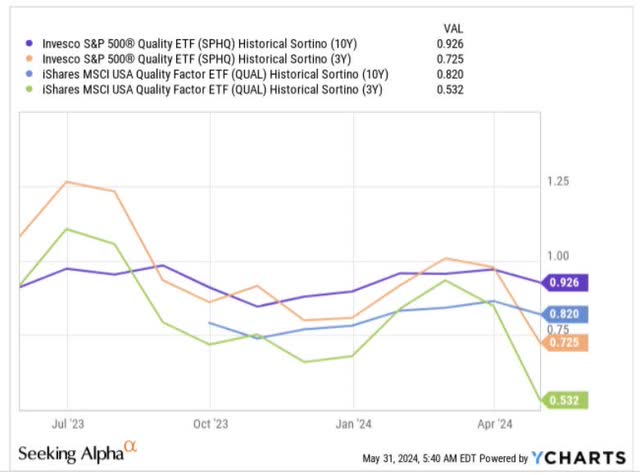
Closing Thoughts – Why SPHQ Does Not Make A Good Buy Now
As implied in the previous section, we think SPHQ has some fine qualities, and we find it difficult to reconcile the large variance in the AUM with the most popular quality ETF in the market. Having said that, we don’t necessarily believe that now is the best time to start a fresh position in SPHQ.
Firstly, note that SPHQ largely consists of large-cap growth stocks, which account for 43% of the total portfolio. The chart below suggests that within the broad U.S. market, large-cap growth stocks look like one of the more overbought pockets in the world, with the relative strength ratio versus the broader markets currently at a 24% premium vs. its long-term average.
YCharts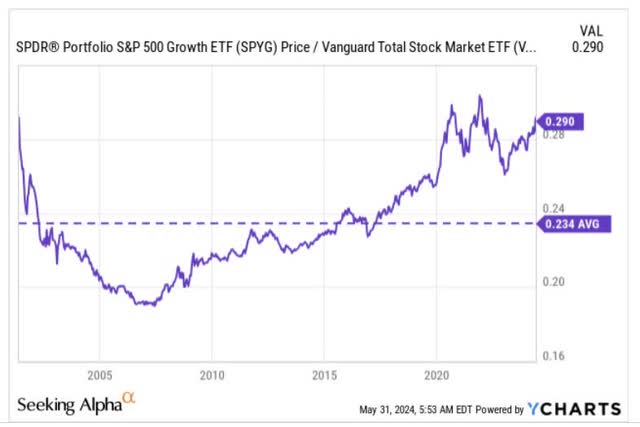
The other major dominating theme within SPHQ is the tech sector, which accounts for a third of the total holdings. With the earnings season almost drawing to a close, it’s fair to say that the tech sector has been the star of the show. As things stand, no other sector has managed to trump earnings expectations the way tech stocks have (a whopping 88% of large-cap tech stocks have beaten earnings estimates), but investors also ought to be mindful of the sky-high valuations associated with the sector.
Factset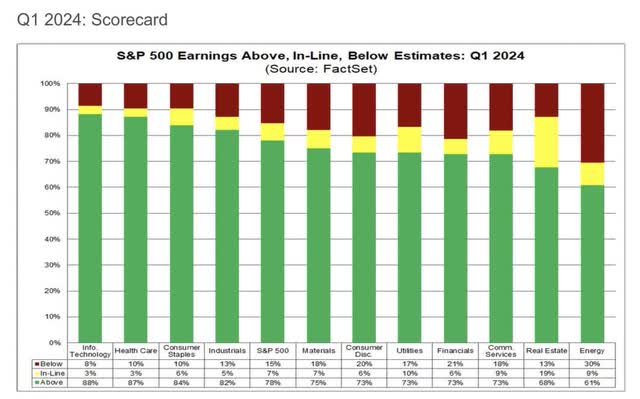
At nearly 30x P/E, it is difficult to expect further outsized gains, more so when it already translates to a steep premium over its 5 and 10-year averages.
Factset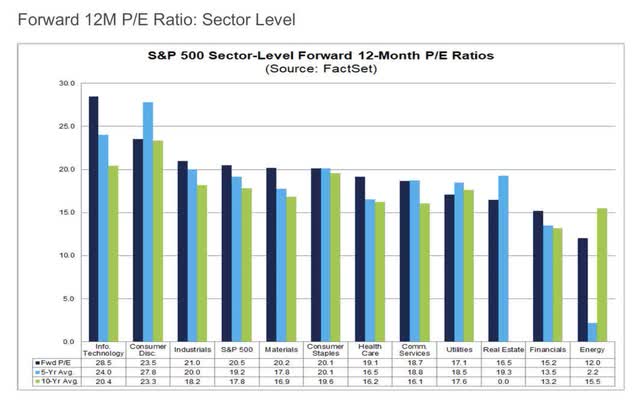
Crucially, on the charts, note that the tech sector’s relative strength versus the benchmark is not far away from the dot-com boom highs, after which we saw a sharp reversal.
YCharts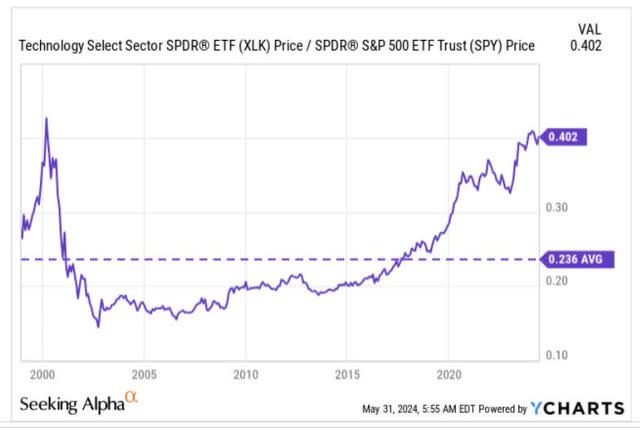
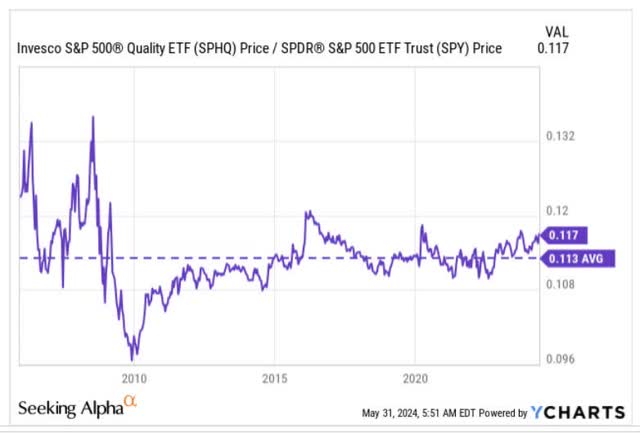
Also, consider that the S&P500 stocks with high-quality scores don’t necessarily offer great value, either. According to Morningstar, SPHQ’s portfolio is now priced at a P/E of 21.6x, which is a tad more than the S&P 500 at 21.1x. However, the benchmark’s holdings are expected to offer slightly better long-term earnings growth of 11.7% as opposed to just 11.3%. Also note that SPHQ’s relative strength versus the S&P5000 is now above its long-term mean, dampening the need to go long.
Finally, if we look at SPHQ’s long-term price imprints on its monthly chart, it looks rather evident that the risk-reward is not too ideal now. SPHQ’s price imprints have largely taken place within the lines of a certain channel, but as things stand the price is now at the upper boundary edge, and a long way off the lower boundary. We believe investors would be better served waiting for a pullback towards the lower half of the channel, before contemplating a long position.
Investing YCharts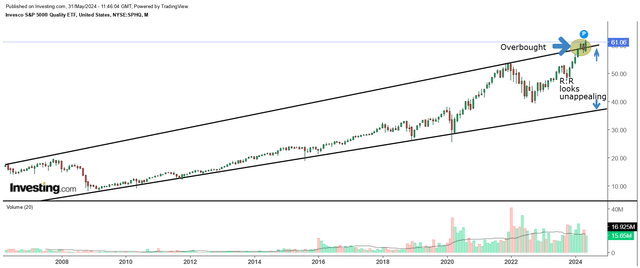
Read the full article here