


Investment thesis
STAG Industrial (NYSE:STAG) has solid business metrics (high occupancy rate and impressive rent escalators), a strong balance sheet with low debt maturities in the upcoming years, as well as an investment pipeline picking up the pace in the increasingly favorable supply-demand environment.
However, it remains heavily undervalued compared to its peers.
Therefore, STAG currently offers a clear path to double-digit total returns resulting from:
- multiple appreciation
- relatively high and well-covered dividend
- rent escalations embedded within its contracts
- further investment activity with the robust project pipeline
Introduction
STAG is a triple-net lease REIT operating within the industrial properties sector.
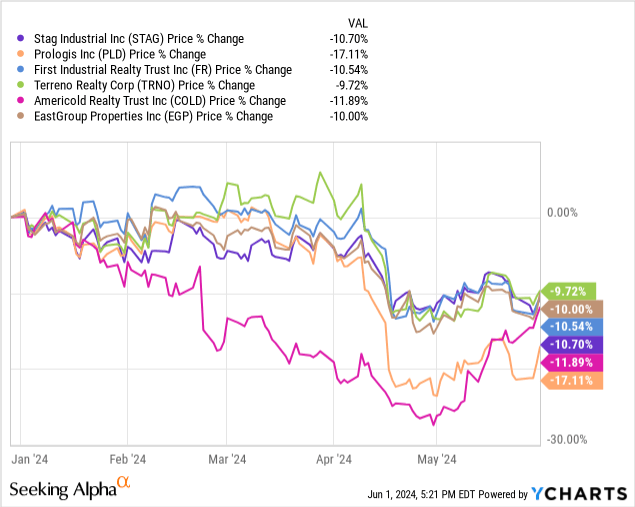
Similarly to its peer group, STAG’s stock price has declined YTD ~10.7%.
STAG is currently heavily undervalued compared to its peers.
Within this article, I’ve discussed its key business and credit metrics. I’ve also provided a valuation outlook.
The above was accompanied by comparisons to the reference group, which allowed me to provide a reasoning behind my investment thesis.
Enjoy the read!
Reference group
As usual, I’ll provide some reference points based on the reference group to paint a better picture of STAG’s metrics and valuation outlook.
Please note that although the stock market provides us with the possibility to establish market-driven and relatively comparable benchmarks, it’s not always possible to identify perfect, academic peers in terms of not only the business but also size, profitability, or geography.
That said, among the entities included within the reference group are:
Further references to the above entities are supported by their Investor Presentations (linked above) and their Q1 2024 SEC filings (linked in the table).
Table 1: The reference group
| Entity | Reference rationale |
|---|---|
| STAG | Industrial REIT. |
| PLD | Industrial REIT. It is the most sizeable entity within the reference group and thus may be less comparable. However, its leading position makes it worth including as a benchmark. |
| FR | Industrial REIT. |
| TRNO | Industrial REIT. |
| COLD | Industrial REIT. |
| EGP | Industrial REIT. |
Without further ado, let’s review STAG’s business!
STAG Industrial – Overview
A favorable supply-demand relationship will support industrial properties
Some major trends are supporting the industrial properties sector, including:
- population growth
- improving lifestyle
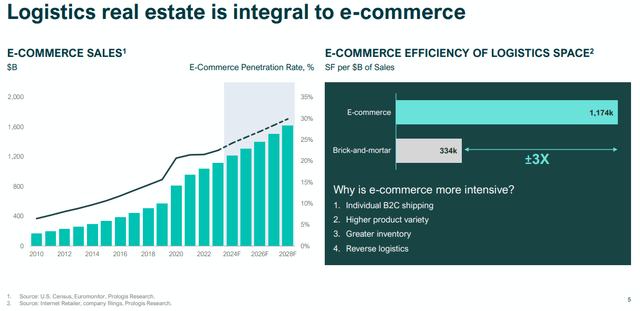
- and the growing importance of e-commerce when compared to brick-and-mortar
PLD’s Investor Presentation PLD’s Investor Presentation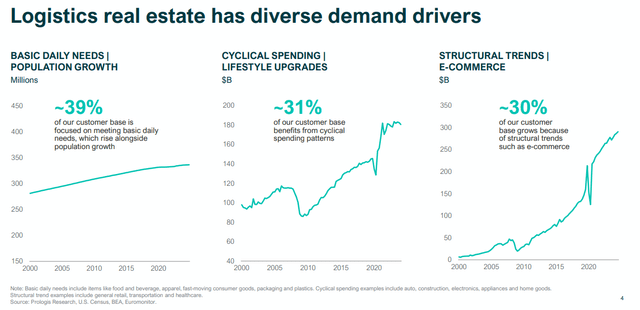
Naturally, the “customer base” to which PLD relates may differ from STAG’s as PLD also operates in Europe, South America, or Asia, however, it remains US-oriented and provides data-driven measures that will support not only its operations but also other industrial REITs’, including STAG.
From the supply side, the sector has struggled with some oversupply issues leading to higher vacancy rates in 2023 compared to 2022. However, new construction starts started to decline in 2023.
As STAG’s COE, William Crooker commented during the Q4 2023 Earnings Call:
While the existing supply is being absorbed at a healthy rate, vacancy ended the year above last quarter’s expectations at 4.9%. While supply remains elevated, new construction starts have declined nationally by approximately 65% on a year-over-year basis as of Q4 of 2023.
In addition, forecast for 2024 and 2025 deliveries are expected to decrease to just 2.2% of stock. Vacancy rates will likely continue to rise in the near term, but we expect the peak to occur sometime in the second half of 2024, with normalization around year-end.
During the Q1 2024 Earnings Call, this view was reestablished:
Our view on the business remains consistent with our fourth quarter call. As anticipated, there are pockets of softness in certain markets, which is driven by increased supply coming online. Additionally, tenants are taking longer to make leasing decisions, which is impacting market occupancy.
However, a significant completion drop is expected in 2024-2025, which will decrease vacancy rates and improve industrial REITs negotiating positions.
PLD’s Investor Presentation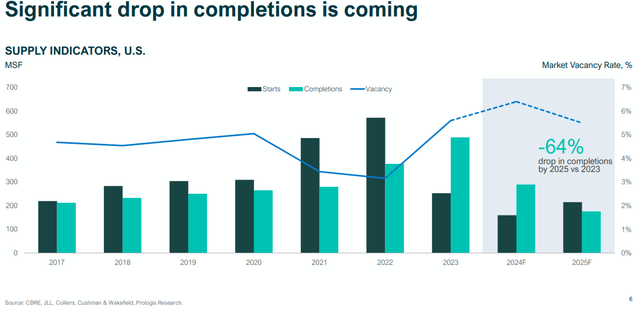
Moreover, STAG recognizes re-shoring and near-shoring trends as other drivers of domestic warehouse space demand.
STAG has a diversified portfolio with properties located across the most relevant markets with ~33.3% of them within a 60-mile radius of Megasite Projects, which are a part of the US initiative – “Investing in America”.
STAG’s Investor Presentation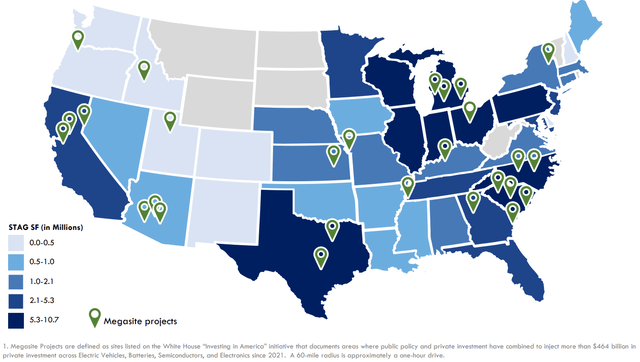
To conclude this point, the expiring over-supply issues may turn into under-supply in the upcoming years, which combined with STAG’s well-located, high-quality properties (with 87% of ABR derived from CBRE Tier 1 and Tier 2 exposure) and its project pipeline constitute an attractive environment to grow further.
Key business metrics
As of March 2024, STAG had an occupancy rate equal to ~97.7% with a weighted average lease term (WALT) of 4.4 years.
STAG’s Q1 2024 10-Q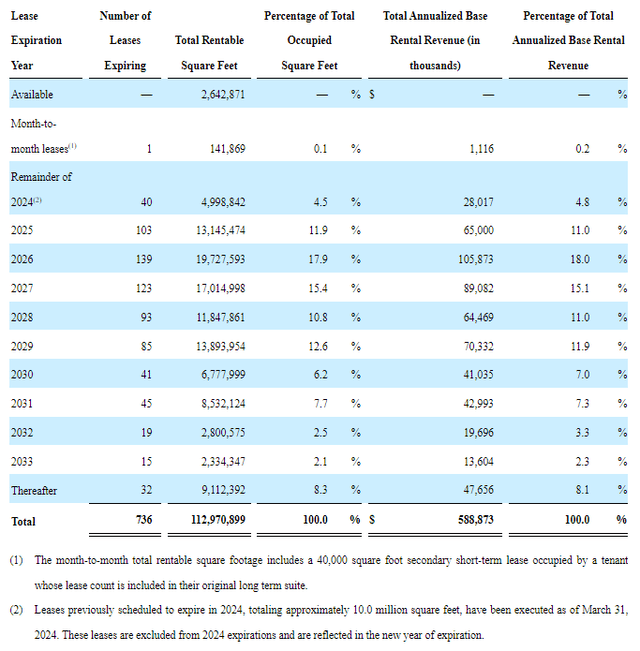
Considering the current state of the supply, the CEO’s comments on the matter, and the well-laddered structure of STAG’s lease schedule, WALT stands solidly and I believe that STAG will be able to address future lease expirations efficiently, even in case of a lack of renewals.
As for the occupancy rate, for reference, this metric amounted to:
- 95.5% for FR
- 96.2% for TRNO
- 97.7% for EGP
- 97.0% for PLD, on their “own and managed” properties basis, which includes consolidated properties and properties resulting from co-investment ventures
I often mention that triple net lease REITs are typically capable of securing from 1% to 2% annual rent escalations, however, as STAG indicated in its latest Investor Presentation, it expects ~2.7% of weighted average rent increases in 2024.
On top of that, the Company keeps signing new leases with even higher escalators embedded, reaching 3-4% range. As William Crooker, the CEO, and Matts Pinard, the CFO, commented during the Q1 2024 Earnings Call:
So we’re seeing average escalators being signed in the 3.5% range. We signed one this last quarter at had a 4% on it. So we’re still seeing some strong escalators and strong face rental rates. (…)
(…) the weighted average escalator across the portfolio continues to increase. There is upward pressure. It’s really just math, as Bill explained, our weighted average escalator right now is a tick above 2.7%. But again, as Bill mentioned, you continue to sign those leases with the 3%, 3.5%, 4% escalators. That number will increase mathematically, and that’s the biggest, I would say, building block to our sustainable same-store growth.
I don’t believe that many investors will have doubts whether this is an impressive number or not, but for transparency:
- these low single-digit rent escalations tend to add up over time and heavily impact the bottom line
- especially within the triple-net lease structures, under which the tenant covers a substantial amount of costs related to operating and maintaining the property
Strong balance sheet
STAG has an investment-graded balance sheet with a BBB credit rating.
Its credit metrics stand well when compared to the reference group – please review the table below.
Table 2: Selected credit metrics
| STAG | PLD | FR | TRNO | COLD | EGP | |
|---|---|---|---|---|---|---|
| Credit rating | BBB | A | BBB | BBB+ | BBB | BBB |
| % of debt fixed rate | 83,7% | 92.5% | 86.3% | 74.2% | 86.1% | 100% |
| Fixed charge coverage ratio | 5.5x | 7.6x | 4.4x | 7.2x | – | – |
| WA debt maturities | 4.3 | 9.3 | 4.5 | 4.1 | 4.9 | – |
Excluding much more sizeable PLD, each metric seems to be in line with the reference group level. STAG has a well-laddered debt maturity schedule with a weighted average years to maturity amounting to 4.3.
STAG’s Investor Presentation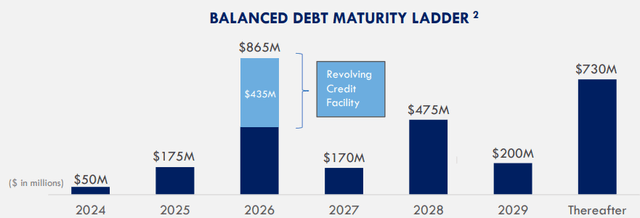
Moreover, the share of debt in STAG’s capital structure amounted to ~27.2%, with negligible secured debt.
Within the Company’s 10-K for FY 2023, STAG presented a number of its financial covenants.
STAG’s 10-K for FY 2023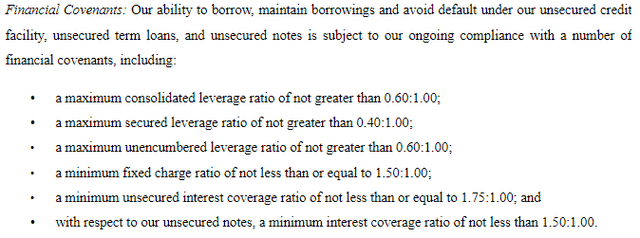
Considering the above credit metrics and the covenants, it’s fair to say that STAG has a safe financing structure and plenty of room until the conditions are endangered.
STAG’s Q1 2024 10-Q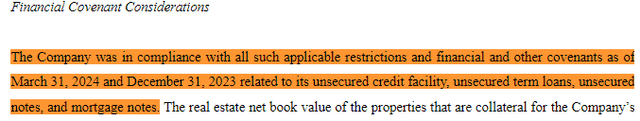
Investment activity
Please review STAG’s investment activity during the 2018 – 2023 period with its 2024 guidance (in $ million) on the chart below.
Cash Flow Venue compilation based on STAG’s 10-K’s and Q4 2024 Earnings Call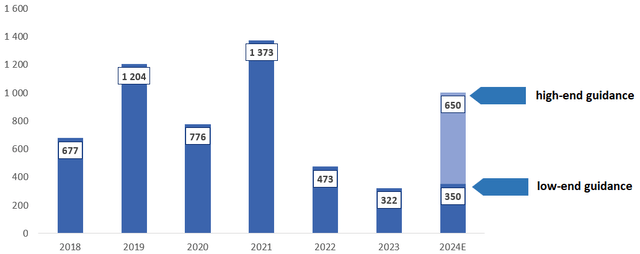
Referring to the Q4 2022 Earnings Call, the Management indicated that the industrial market as a whole was down on a year-over-year basis regarding the investment activity, which was reflected in STAG’s activity as well (down to $473m investment volume in 2022 from $1373m in 2021).
Moreover, the 2022 investment volume was heavily dominated by the Q1-Q2 2022 with a modest activity towards the end of the year. As a result of that and the high uncertainty surrounding the markets, the management presented quite a wide range of investment guidance for 2023, ranging from $300m to $700m.
It was realized close to the low end of the range at a $322m investment volume.
However, at the beginning of 2024, the market started to pick up the pace in terms of investment activities, as the Company’s CIO, Michael Chase commented during the Q1 2024 Earnings Call:
So the pipeline grew immediately out of the gate in the beginning of the first quarter and it accelerated and gained momentum throughout the quarter. Anecdotally, we underwrote 4x the number of deals in Q1 of ’24 than we did in Q1 of ’23. So there was plenty of momentum during the quarter, and that was the indicative of the increase in the pipeline. At the end of the quarter and in April, when the 10-year spiked interest rates rose, volatility crept back into the market. We don’t know if that’s going to be permanent or whether that’s going to be short term. We don’t know what the effect will be on the pipeline going forward.
The CIO also mentioned the return of uncertainty around the quarter-end, which could impact their robust pipeline. Nevertheless, STAG upheld its investment guidance.
Therefore, investors can expect more activity in 2024 with high 6-7% cap rates secured.
Attractive and well-covered dividend
STAG currently offers monthly, attractive, and well-covered dividends, yielding 4.2%, which is the highest level among the reference group.
Please review the selected dividend-related metrics in the table below.
Table 3: Dividend-related metrics
Although the dividend yield is relatively attractive, that’s not the most important component of STAG’s double-digit total returns potential.
While evaluating REITs’ payout ratio I generally refer to AFFO-based metrics, however, I’ve also presented the FFO payout ratio as FFO is a standardized metric, which makes it easier to compare across different companies.
STAG is undervalued – Valuation outlook
As an M&A advisor, I usually rely on a multiple valuation method that is a leading tool in transaction processes, as it allows for accessible and market-driven benchmarking.
Please review the reference group in the table below – with P/FFO multiples provided.
Table 4: STAG’s and the reference group P/FFO
The P/FFO multiples of STAG’s peers range from 19.5x to 25.4x.
Considering:
- shared (between STAG and the reference group) headwinds resulting from a high-interest rate environment, over-supply during recent years, and lower market activity in terms of transaction volumes
- shared (between STAG and the reference group) value drivers accompanying the industrial property sector relating to the upcoming, ongoing improvement in the supply-demand relation
- great business metrics in terms of occupancy, WALT, rent escalations,
- improving project pipeline
- a strong balance sheet with credit metrics in line with its peers
I believe that such a significant valuation gap between STAG and the reference group is not justified.
Yes, its peers were capable of growing their dividends at a noticeably more dynamic pace, however, given STAG’s high dividend yield and a reasonable payout ratio, this weakness is somewhat compensated.
There’s a ~37.7% upside required for STAG’s P/FFO to reach the reference group’s median, which may seem unlikely.
However, multiple appreciation of just a fourth of this would mean ~9.4% upside resulting just from the valuation shift.
Combining it with the 4.2% dividend yield and growth resulting not only from investment activity but also embedded rent escalations, there’s a potential for double-digit total returns.
Having in mind STAG’s business model, its business and credit metrics, as well as its position to further expand, I view this as a highly realistic scenario, which would be further supported by the interest rate cuts.
Risk factors
Prolonging a high-interest rate environment until noticeable debt maturities could hurt STAG’s financial performance by forcing it to refinance at a higher cost.
Moreover, it could also negatively impact the project pipeline slowing STAG’s external growth prospects.
Any potential tenant issues or problems with addressing the expiring leases could also hurt its financial performance.
Each of the above and other material adverse changes could lead to higher stock price volatility and make me reconsider my bullish stance.
The bottom line
Despite solid business metrics, a strong balance sheet, an attractive dividend yield, and a clear growth proposition, STAG remains heavily undervalued compared to its peers.
It currently offers a highly realistic potential for double-digit total returns resulting from:
- multiple appreciation
- well-covered dividend
- contractual rent growth with weighted average rent escalations of 2.7% (further increasing)
- investment activity with the project pipeline picking up the pace
Read the full article here