


Intro
We wrote about Star Group, L.P. (NYSE:SGU) back in April of this year when we were encouraged by what we were seeing in the company’s technicals. A technical breakout was confirmed on the long-term chart and the generous dividend had grown for 10 years straight. While investors may bemoan the lack of forward-looking guidance in this play (due to the company’s volumes being continuously at the behest of the weather), management continues to double down on areas where it has control. These initiatives include lowering operating costs & improving customer retention levels by providing more value. Therefore, even though lower volumes of heating oil & propane in Star’s third quarter led to a net earnings loss for the quarter, the company still managed to generate significant operating cash flow ($116.5 million) which again helped to bring the company’s debt levels lower. Remember, due to Star’s relatively low capital spending requirements, free cash flow should continue to be generated even in a negative earnings environment as long as working capital is managed well.
Star’s cash position, shareholder-equity & debt position at the end of Q3 this year are all better than what was reported at the end of fiscal 2022 as we see below. Furthermore, Star has also brought down the float, which is another shareholder-friendly trend as a lower number of shares increases existing shareholder stakes in the company, all things remaining equal.
| Period | Q3-2023 | Q2-2022 |
| Balance Sheet Cash | $57.1 million | $14.6 million |
| Total Debt | $247 million | $283 million |
| Book/Value Per Share | $8.23 | $7.25 |
| Number Of Shares | 35.6 million | 36.1 million |
| Shareholder Equity | $292.9 million | $261.6 million |
Suffice it to say, even though shares have only returned approximately 5% (when we include dividend payments) over the past 7+ months, we still believe Star Group is in a position of strength as the technicals demonstrate below.
Long-Term Chart
Although we called the upside technical breakout at the time, shares merely came back to successfully test support in October of this year. Therefore although the long-term MACD & stochastics may look overbought at present, we believe greater merit should be given to how shares successfully bounced off underside support just a mere 8 weeks ago.
Star Group Long-Term Technicals (StockCharts.com)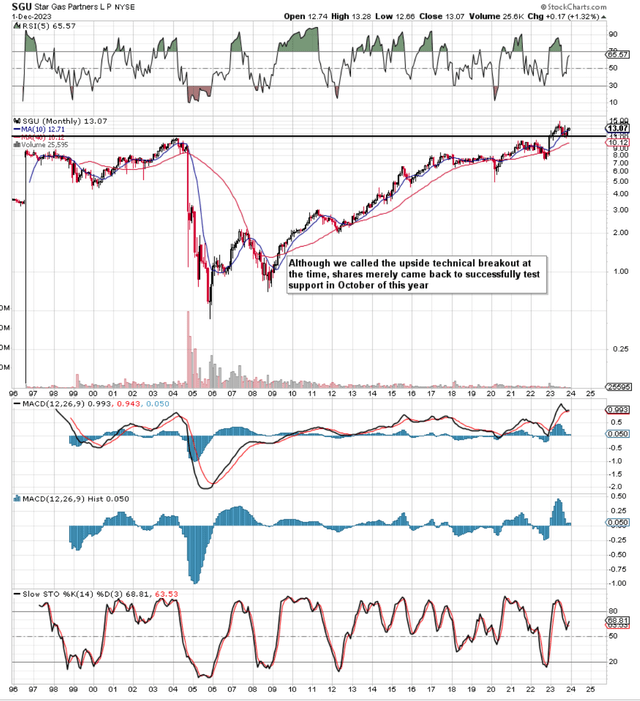
Intermediate 5-Year Chart
Furthermore, if we pull up an intermediate 5-year chart, we see that the bouncing off long-term support has resulted in a very attractive oversold MACD buy signal. These signals can give excellent setups in trending markets as we witnessed in early 2020 and late 2021 when the MACD had stooped to a similar oversold level. Suffice it to say, a MACD crossover buy signal carries weight on long-term charts due to the dual role of the indicator where it combines an oscillator (momentum) with a dual moving average crossover system (trend). Furthermore, the height at which the MACD indicator arrived in June of this year (when shares of SGU surpassed $15) demonstrates the clear lack of a bearish divergence & the likelihood that the present bullish trend will continue.
Star Group Intermediate Chart (StockCharts.com)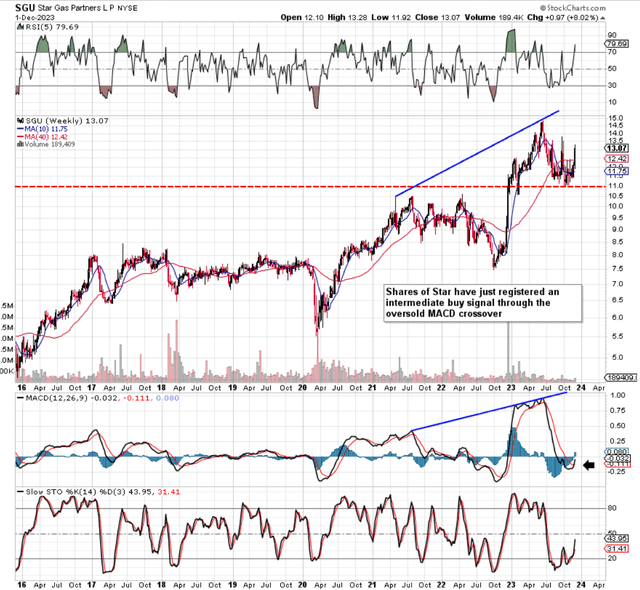
Daily 12-Month Chart
Given how buying volume continues to supersede selling volume, we continue to believe that SGU has been undergoing a bottoming or continuation pattern (bullish) for the best part of 12 months now. We state this for two reasons. Firstly, ever since shares broke out above long-term resistance late last year, we have seen a drop-off in general volume which is indicative of continuation patterns. Secondly though and here is the kicker. Buying volume has been much heavier on spikes in the share price in past months compared to selling volumes on declines. This again is a trend we want as greater volume should always occur in the same direction as the prevailing trend. Therefore, being chartists (where we believe volume trends precede share-price action), the most likely result here for SGU is that shares will eventually take out those June’2023 highs of $15+ per share to the upside.
Star Group Daily Technicals (StockCharts.com)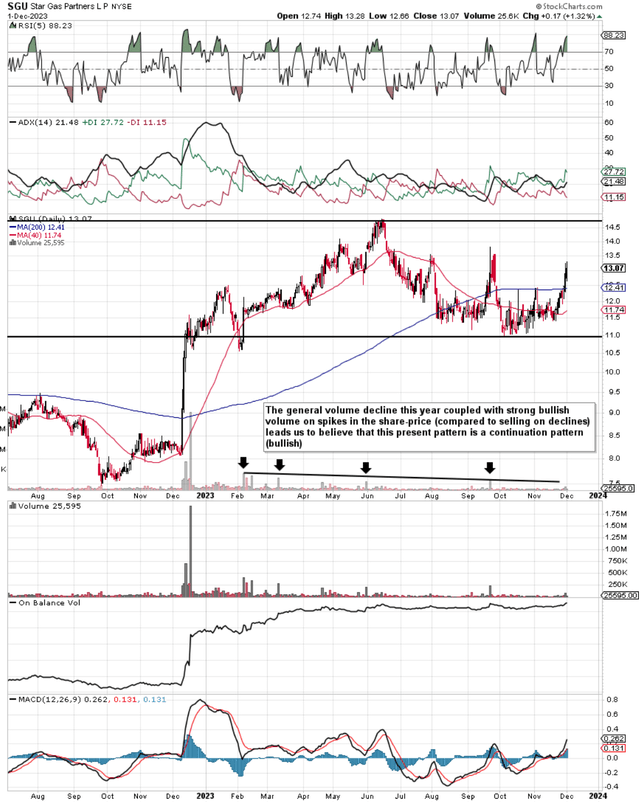
Conclusion
To sum up, we are reiterating our ‘buy’ rating in SGU primarily due to its bullish technicals and improving balance sheet trends where debt & the float continue to fall and book value per share continues to rise. Furthermore, the 5%+ dividend remains a strong calling card here for investors as it remains well covered by cash flow and has been growing on average by 5%+ per year over the past 11 years. We look forward to continued coverage.
Read the full article here