


Investment Thesis
Not all investors have the time and willingness to build a portfolio that consists of an extensive number of companies to ensure a good level of diversification. Doing so implies a diminished risk-profile for your portfolio and an elevated chance of favorable investment results.
For this reason, in today’s article, I will present you with a diversified dividend portfolio that consists of just three ETFs and three individual companies.
I will demonstrate how you could allocate the amount of $50,000 among these three ETFs and three individual companies to invest with a relatively low level of risk, targeting positive investment returns with a significant chance of success.
This portfolio combines dividend income with dividend growth, reaching a Weighted Average Dividend Yield [TTM] of 2.92% and a 5 Year Weighted Average Dividend Growth Rate [CAGR] of 9.31%.
These numbers indicate that this dividend portfolio is most suitable for younger investors with a long-investment horizon. This is due to the fact that they can benefit in particular from the strong dividend growth rates that the portfolio provides them with.
Part of today’s dividend portfolio are three ETFs, each comprising 30% of the total investment portfolio:
- Schwab U.S. Dividend Equity ETF (SCHD)
- iShares Select Dividend ETF (DVY)
- Vanguard Dividend Appreciation ETF (VIG)
The following individual companies are also part of this dividend portfolio, each holding a proportion of 3.33%:
- Apple (AAPL)
- BlackRock (BLK)
- Johnson & Johnson (JNJ)
I will demonstrate how this dividend portfolio achieves extensive diversification across companies and sectors, even when distributing the three ETFs (SCHD, DVY and VIG) across their respective companies and sectors.
Moreover, I will show you that the portfolio reaches a relatively low company-specific allocation risk: only Apple, BlackRock and Johnson & Johnson, which all have an attractive risk/reward profile from my point of view, hold a proportion of more than 2.3% of the overall investment portfolio.
Overview of the 3 Selected ETFs and 3 Individual Companies That Are Part of This Dividend Portfolio
|
Symbol |
Name |
Sector |
Industry |
Country |
Dividend Yield [TTM] |
Dividend Growth 5 Yr [CAGR] |
Allocation |
Amount in $ |
|
SCHD |
Schwab U.S. Dividend Equity ETF |
ETF |
ETF |
United States |
3.52% |
13.05% |
30% |
15,000 |
|
DVY |
iShares Select Dividend ETF |
ETF |
ETF |
United States |
3.68% |
5.95% |
30% |
15,000 |
|
VIG |
Vanguard Dividend Appreciation ETF |
ETF |
ETF |
United States |
1.86% |
9.52% |
30% |
15,000 |
|
AAPL |
Apple |
Information Technology |
Technology Hardware, Storage and Peripherals |
United States |
0.48% |
6.15% |
3.33% |
1,666.66 |
|
BLK |
BlackRock |
Financials |
Asset Management and Custody Banks |
United States |
2.51% |
10.72% |
3.33% |
1,666.66 |
|
JNJ |
Johnson & Johnson |
Health Care |
Pharmaceuticals |
United States |
3.02% |
5.83% |
3.33% |
1,666.66 |
|
Average: 2.92% |
Average: 9.31% |
Sum: 100% |
Sum: 50,000 |
Source: The Author, data from Seeking Alpha
Risk Analysis of The Current Composition of This Dividend Portfolio
The following risk-analysis of this dividend portfolio, which consists of three ETFs (SCHD, DVY and VIG) and three individual companies (Apple, BlackRock, and Johnson & Johnson), aims to demonstrate the portfolio’s reduced risk level. The composition of the portfolio has been chosen to enhance the probability of successful investment outcomes, if committed to a long-term investment approach.
Risk Analysis of the Portfolio Allocation per Company/ETF
The chart below illustrates that each of the selected ETFs hold 30% of the overall investment portfolio, collectively accounting for 90%.
Apple, BlackRock, and Johnson & Johnson, which represent the only individual positions of this dividend portfolio, represent 3.33% of the portfolio each, equalling 10% of the overall portfolio.
Source: The Author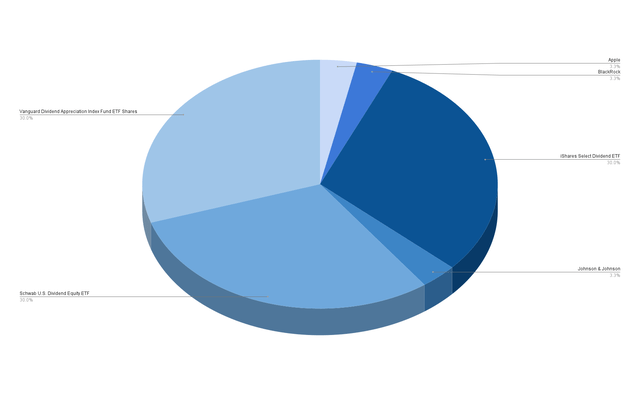
Risk Analysis of the Company-Specific Concentration Risk When Allocating SCHD, DVY and VIG Across the Companies They Are Invested in
The graphic below shows the allocation of the portfolio’s holdings when distributing SCHD, DVY and VIG across the companies they are invested in.
Source: The Author, data from Seeking Alpha and Morningstar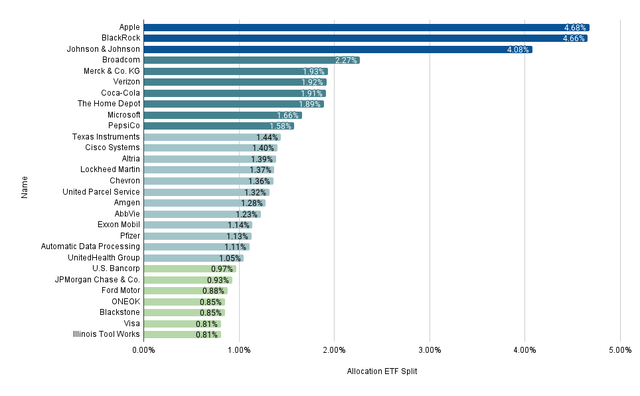
It can be highlighted that the three individual companies Apple, BlackRock, and Johnson & Johnson account for a larger proportion of the overall investment portfolio.
Apple represents 4.68% of the overall investment portfolio when distributing the three ETFs across the companies they are invested in. The portfolio is both directly invested in Apple (with a percentage of 3.33%) and indirectly via Vanguard Dividend Appreciation ETF.
BlackRock represents 4.66% of the overall investment portfolio. The portfolio is directly invested into BlackRock and indirectly via Schwab US Dividend Equity ETF and Vanguard Dividend Appreciation ETF.
Johnson & Johnson accounts for 4.08% of the overall portfolio. The portfolio is directly invested in Johnson & Johnson and indirectly via Vanguard Dividend Appreciation ETF.
The fact that no individual position accounts for more than 5% of the overall portfolio, even when distributing the three ETFs SCHD, DVY and VIG across the companies they are invested in, underscores its reduced risk level and elevated chance of achieving positive investment results.
Besides Apple, BlackRock, and Johnson & Johnson, all other companies have a proportion of less than 2.3% of the overall investment portfolio and are indirect investments via one of the three selected ETFs.
The relatively low proportion of these companies compared to the overall investment portfolio bolsters my confidence in its thoughtful construction, designed to prevent any single company from holding a disproportionately large portion. This approach also indicates an attractive risk/reward profile for the portfolio.
Risk Analysis of the Portfolio’s Sector-Specific Concentration Risk When Distributing SCHD, DVY, and VIG Across the Sectors they are Invested in
The chart below demonstrates the portfolio’s diversification across sectors when allocating SCHD, DVY and VIG across the sectors they are invested in.
Source: The Author, data from Seeking Alpha and Morningstar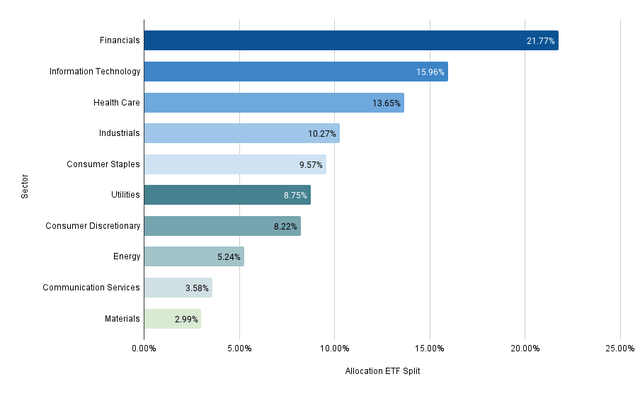
You can see that the Financials Sector accounts for the largest part of this dividend portfolio, representing 21.77%, followed by the Information Technology Sector (15.96%), the Health Care Sector (13.65%), and the Industrials Sector (10.27%).
All other sectors account for less than 10% of the overall investment portfolio: the Consumer Staples Sector accounts for 9.57%, the Utilities Sector for 8.75%, Consumer Discretionary Sector for 8.22%, the Energy Sector for 5.24%, the Communication Sector for 3.58%, and the Materials Sector for 2.99%.
The chart underscores the portfolio’s reduced sector-specific concentration risk. Only the Financials Sector slightly exceeds 20% of the total portfolio, while all other sectors represent less than 16% each. This allocation indicates an extensive portfolio diversification across sectors.
However, it should be highlighted that the Real Estate Sector is not represented in this dividend portfolio. Therefore, to increase the portfolio diversification to an even higher degree, you could incorporate a company from the Real Estate Sector.
Realty Income (O), for example, could be an appealing choice for this dividend portfolio, due to its relatively high Dividend Yield [FWD] of 5.39% and attractive risk/reward profile. In addition to that, it can be highlighted that Realty Income’s low 24M Beta Factor of 0.65 indicates that you can additionally reduce portfolio volatility by incorporating the company.
Risk Analysis: Analyzing the 3 Individual Companies with the Largest Proportion of This Overall Portfolio
Apple (with a proportion of 4.68% of the overall investment portfolio), BlackRock (4.66%) and Johnson & Johnson (4.08%) represent by far the largest holdings of this dividend portfolio.
I am convinced that this portfolio provides investors with an attractive risk/reward profile due to the three companies coming attached to a relatively low risk level while offering investors relatively high chances of achieving an attractive Total Return.
Apple, BlackRock and Johnson & Johnson’s Profitability Metrics Underline Their Strong Positions in Their Respective Industries
All three companies have significant competitive advantages, are financially healthy and are well positioned in their respective industries. Apple, BlackRock and Johnson & Johnson’s financial health and their excellent positions within their industries are reflected in their high EBIT Margins [TTM] (29.82%, 35.35% and 27.97% respectively) and their high Net Income Margins [TTM] (25.31%, 30.66% and 35.10% respectively).
Source: The Author, data from Seeking Alpha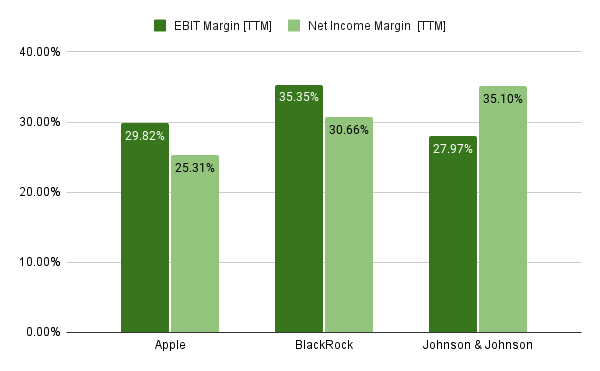
Apple, BlackRock, and Johnson & Johnson’s Growth Metrics Underscore that their Growth Prospects Are Positive
The chart below further indicates that Apple, BlackRock and Johnson & Johnson are on track when it comes to growth. This theory is underlined by the companies’ EPS Diluted Growth Rate 3 Year [CAGR] of 23.18% (Apple), 5.80% (BlackRock) and 27.64% (Johnson & Johnson), as well as their EBIT Growth Rate 3 Year [CAGR] of 19.91% (Apple), 4.49% (BlackRock) and 11.23% (Johnson & Johnson).
These metrics serve as additional indicators of the portfolio’s reduced risk level, implying an elevated chance of successful investment performance for investors who implement it.
Source: The Author, data from Seeking Alpha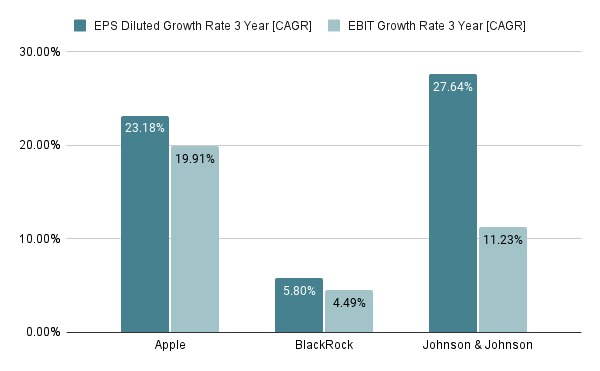
Risk Analysis of The Equity Style of This Dividend Portfolio
The graphic below illustrates the equity style of this dividend portfolio when distributing the three ETFs (SCHD, DVY and VIG) across the companies they are invested in.
My hypothesis of this dividend portfolio having a lowered risk level is supported by its composition: 66% are large-cap companies, 27% mid-cap, and only 7% are small-cap.
The reduced risk level is further confirmed by the fact that 45% of the selected companies are value companies, 49% are core companies (which combine value and growth) and only 6% are growth companies. which come attached to a higher risk level.
It can further be highlighted that 37% of the portfolio consists of large-cap companies that combine value and growth (core companies), and 24% of the portfolio consists of large-cap companies with a value focus, additionally substantiating the portfolio’s lowered risk profile and its superior potential for positive investment outcomes.
Source: The Author, data from Morningstar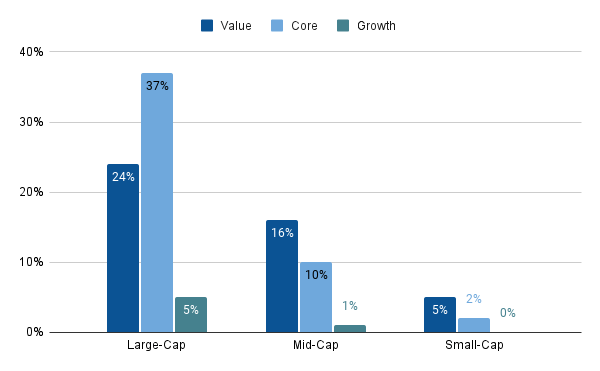
Conclusion
Many investors lack the time and willingness to construct an extensively diversified dividend portfolio with a wide range of individual companies, which is crucial for minimizing the risk-level of their investment portfolio.
For this reason, in today’s article, I have explained in greater detail how you could allocate the amount of $50,000 among three dividend paying ETFs and three dividend paying individual companies, securing extensive diversification and diminished portfolio risk.
The portfolio I have presented today is particularly attractive for younger investors that have a long investment-horizon and plan to benefit from the attractive dividend growth rates that it provides investors with.
The portfolio offers investors with a 5 Year Weighted Average Dividend Growth Rate [CAGR] of 9.31% and a Weighted Average Dividend Yield [TTM] of 2.92%, indicating that it blends dividend income with dividend growth. Due to the portfolio composition, I further believe that it is suitable to achieve an attractive Total Return when investing over the long term.
Each included company accounts for less than 5% of the overall portfolio, even when distributing the three ETFs (SCHD, DVY and VIG) across the companies they are invested in, indicating a minimization of company-specific concentration risk.
I am further convinced that this dividend portfolio provides you with an attractive risk/reward profile due to the three companies that account for the largest share (Apple, BlackRock and Johnson & Johnson) coming attached to a low risk level, thus offering investors a high probability of attractive investment results.
For those seeking an even broader diversification, integrating a company from the Real Estate Sector could be a beneficial option. With the incorporation of Realty Income, for example, you could not only amplify the portfolio’s diversification, but also decrease its risk level, as indicated by the company’s 24M Beta Factor of 0.65.
I am convinced that the portfolio presented today is tailor-made for a buy-and-hold-approach, ideal for investors seeking a more passive investment approach.
You can implement this portfolio without the need to closely follow the financial results of the companies that are part of it, since the portfolio minimizes the demands for active portfolio management.
The dividend portfolio presented today offers you the luxury of being able to spend more time with your friends and family, while steadily increasing your wealth with a high chance of success.
Author’s Note: Thank you for reading, and I wish you and your families a Merry Christmas and all the best for 2024!
Read the full article here