


Financial writers often present the weekly survey of bullish and bearish opinions of AAII members to gain insight into what the stock market will do. However, there’s another AAII survey that is not as well known, which can be equally insightful. It’s the percent AAII members have allocated to the stock market. This number is compiled monthly by AAII with historical data available for research by any member under the title “asset allocation survey.”
Right now, members have 70.4% of their assets invested in the stock market. The rest is in bonds or cash (money markets). This is the highest percent since 2021 and only the seventh time since 2000 when it exceeded 70%. Almost every time it did, trouble followed.
We believe this AAII data adds to the other indicators we presented in recent articles the past few weeks (here, here and here) that indicate this bull market is showing signs of exhaustion. We’ve been expecting the S&P 500 to top in August or September, and we believe this is added confirmation that this forecast is probably correct.
We believe these indicators suggest that the major indices will produce a net-zero return over the next nine months and a negative return over the next eighteen. Furthermore, we are expecting at least a 15% decline sometime in that eighteen-month time period.
AAII Stock Allocation
This chart plots the percent stock allocation of AAII members from 2000 to present. Over the years, it’s ranged from a high of 77% to a low of 40%.
Ideally, you’d want the highest allocation at the lows of a bear market. You’d also want the lowest allocation at the top of a bull market. This low allocation would minimize losses as prices declined. However, the record shows members do the opposite of this. You get a high allocation at the top and low allocation at the bottom, so it works as a contrary opinion indicator, just like the bull-bear weekly survey.
The Percent Stock Allocation of AAII Members From 2000 to Present (The Sentiment King)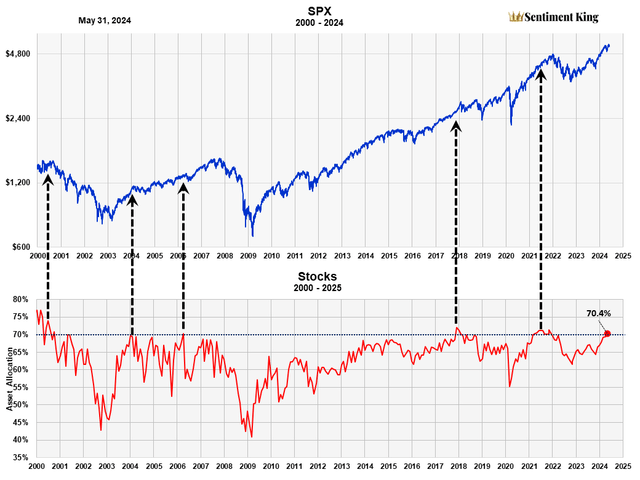
As you can see, the two lowest allocations of 40% occurred at the bottom of the 2000-02 and 2007-09 bear markets.
The highest allocations occurred before major corrections or bear markets, although here the timing is not as good. An allocation of 70% or more seems to be an important cutoff. This has happened six times since 2000, including the present moment. We’ve pointed out the previous five times with black arrows. Most occurred before major corrections.
AAII Cash Allocation
We find a similar situation with the AAII cash allocation, which is graphed below.
The Percent Cash Allocation By AAII Members From 2000 to Present (The Sentiment King)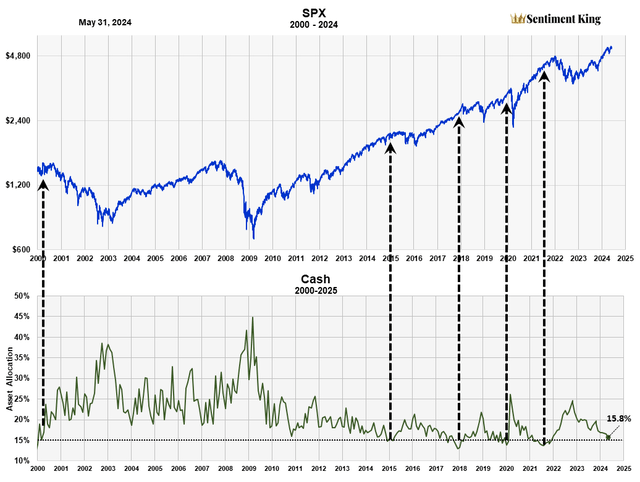
We see the highest cash allocation at major bear market lows or the end of significant corrections. At the 2003 and 2009 market lows, members held 40% to 45% cash. It went to 25% at the 2020 and 2022 bear market lows.
You also see the opposite – low allocations – at market tops, which we’ve indicated with black arrows. Here, an important cut-off seems to be 15% or less. The current reading of 15.8% is just 1% above that cut off. It might actually be comparable because high money market rates are drawing in more assets to this class. I’ve received numerous comments about this in recent articles.
Why the Theory Of Contrary Opinion Works
I wrote this in a recent article:
The usual explanation of why the theory works is this. If everyone is bullish, investors have already purchased so even with additional positive, economic news, there are few buyers left to push prices higher. The price advance is “exhausted” so to speak. So just a little profit taking by current investors will move prices lower. Remember, data doesn’t drive prices higher, buyers do.
On the other hand, if everyone is bearish, they have already sold. So, even with more bad news, there are few sellers left to push prices lower. The sellers are “washed out.” Therefore, just a little buying by bargain hunters will move prices higher. This is pretty much what happened in the latter half of 2022.
I also wrote this in March:
What’s more important when determining market direction – the positive economic factors everyone thinks will drive prices higher, or the statistical fact that “so many” people believe prices are headed higher? After 50 years of market study, I say it’s the latter. In any event I believe we will again learn something important very soon.
Conclusion
As we explained in the other articles, we believe the market will produce a net-zero return over the next nine months, and a negative return over the next eighteen. Our usual allocation of stocks and bonds/cash is 80-20. However, our current allocation is 50% stocks, 7% gold, 20% Cash and 23% long-term treasuries. We will reallocate back to 80-20 once we get a significant increase in bearish expectations. How do we specifically determine that?
Our major indicator of market sentiment is called the Master Sentiment Indicator, a composite indicator made from nine classic sentiment indicators like the AAII sentiment survey, two puts and calls ratios from the CBOE, commitment of trader data on the 500 futures, the amount of buying in the ProShares S&P Short fund (SH), and others. When that indicator again moves toward the green zone, like it did in 2022 – which signals “too much” bearish expectations – we will again become unreservedly bullish with the 80-20 allocation. Green zone readings are when sentiment has reached the highest 10% of all readings over the last eighteen years. For a complete explanation about the MSI and the nine indicators, please read this earlier article: The Master Sentiment Indicator Points To Higher Prices.
Before we close, I want to point something out. These AAII asset allocation numbers are reported monthly – they are not short term. So they’re not useful at timing the market. They may point to an exhausted stock market, but the top might be now – or six months away. So, one shouldn’t reduce their stock allocation based solely on these two indicators. But we believe they are an important clue to the direction of the stock market long-term.
Read the full article here