


Welcome back, readers. Happy to have you. Whew, what a week!
If you were sleeping all week and did not witness the daily gyrations of the markets, you would awake at the end of the week to see that most of the markets went nowhere. Except small-cap stocks (IWM). Here is a recap of each day and the week:
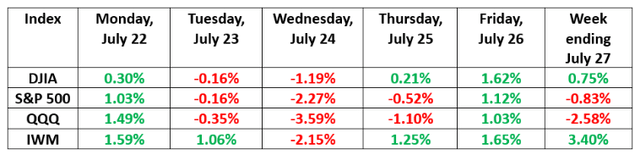
Not surprising that small-cap stocks represented by the Russell 2000 index (the smallest 2,000 market cap stocks in the Russell universe) was the standout winner, along with the Dow Jones Industrial Average (NYSEARCA:DIA) and the big value mega-cap stocks that make up that index. The DIA is comprised of 30 stocks that include some of America’s largest financial companies, and that gives the Dow much more of a “value tilt”.
Nor surprisingly (as we have recently covered in previous market outlooks), the rotation has provided a shift to value stocks for the week, as the VTV (Vanguard Value ETF) was up 1.11% for the week and VUG (Vanguard Growth ETF) was down -2.54%. For five trading days, this is a significant tilt towards value with a 3.65% differential. Much of the shift came from selling out of technology stocks. See the heat map below:
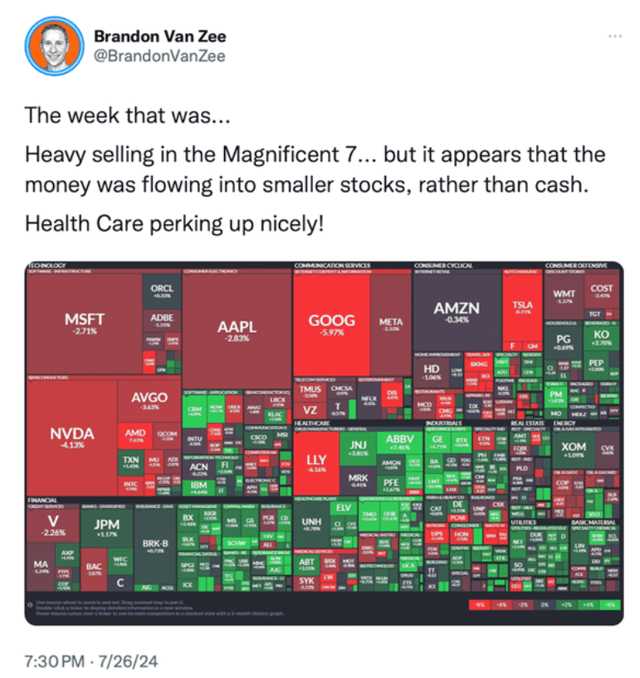
You will notice that the writer above pointed out that the money was rotating from tech stocks to small-cap and health care stocks.
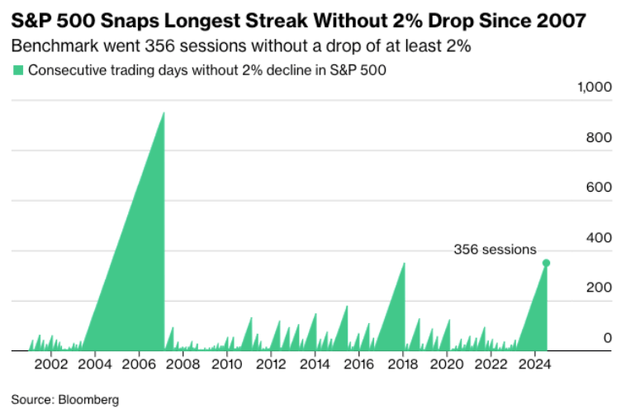
Also, in the outlook last week, we pointed out that it had been more than a year since the S&P 500 had a one-day drop of 2% or more. Not surprisingly, we finally broke that streak, as the S&P 500 had its worst one-day decline in more than a year. See chart below:
Streak snapped. The streak of days without a 2% drop in the S&P 500 has ended after 356 sessions.
Broadening out
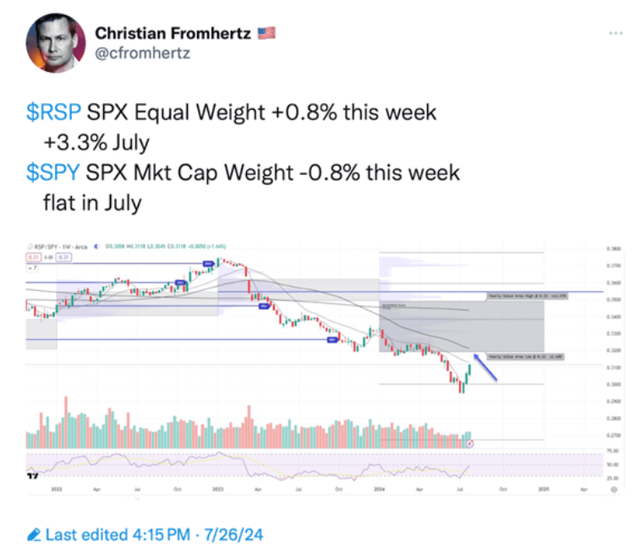
We have suggested, both in Mish’s Daily and here in the weekly market outlook, that it was a few very large-cap stocks that have been fueling this year’s rally in stocks. The S&P 500’s return for the first half of the year has been mainly driven by less than 10 mega-cap stocks, with Nvidia (NVDA) leading the way. This is how the S&P 500 (SPY) works, as it is a market cap-weighted index. This past week saw a shift (another rotation), as we are now beginning to experience momentum picking up in the equal-weighted S&P 500 index (RSP). See the example below:
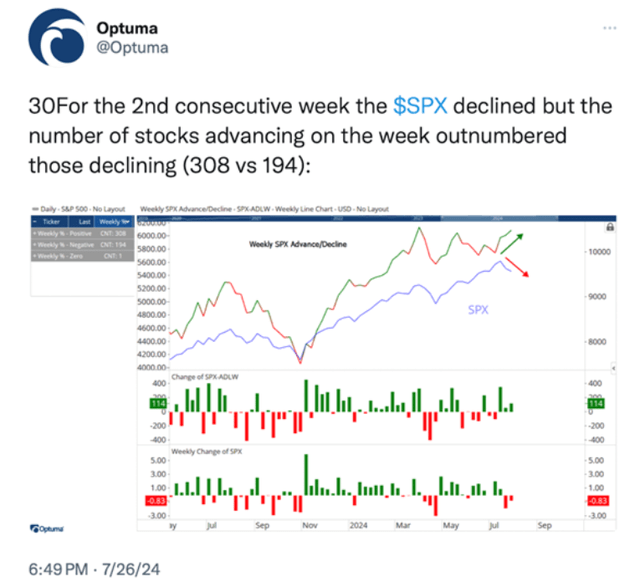
Even though the S&P 500 was down on the week, the S&P 500 had more advancing than declining issues. This is a positive development and real evidence that more (potentially undervalued stocks) stocks are beginning to enter a positive period of rewarding investors. See chart below:
The Rotation Continues
We shared details of this rotation in our commentary last week. Also, we have been pounding the table on the merit of small-cap stocks over the past few weeks. If you have not yet reviewed the market outlooks from July 15 and 22, you may use the links below to access both articles.
- July 15th Market Outlook
- July 22nd Market Outlook
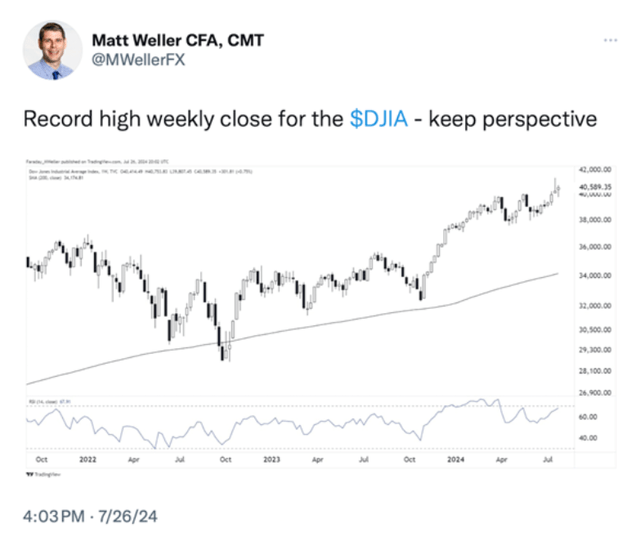
The S&P 500 (cap-weighted index) declines, but the Dow Jones closes on another weekly high. See chart below:
The small-cap stock momentum continues
As we have elaborated in-depth in our previous market outlooks, small-cap and value-oriented (finance and health care) stocks have lagged the narrowly driven, mostly tech-influenced markets for most of 2024. On a number of occasions, we suggested that we are either going to see a “catch-up” or a breakdown.
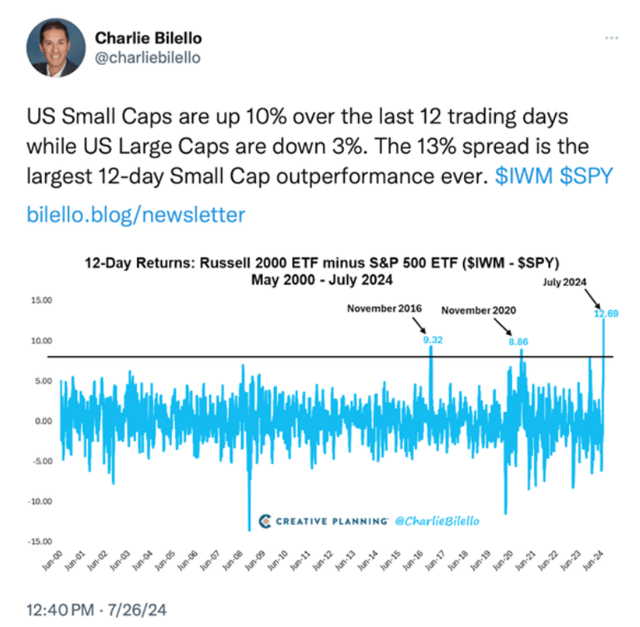
The last 12 trading days have seen a thrust higher for small-cap stocks, while many of the largest-cap, especially technology-related, have sold off. See chart below:
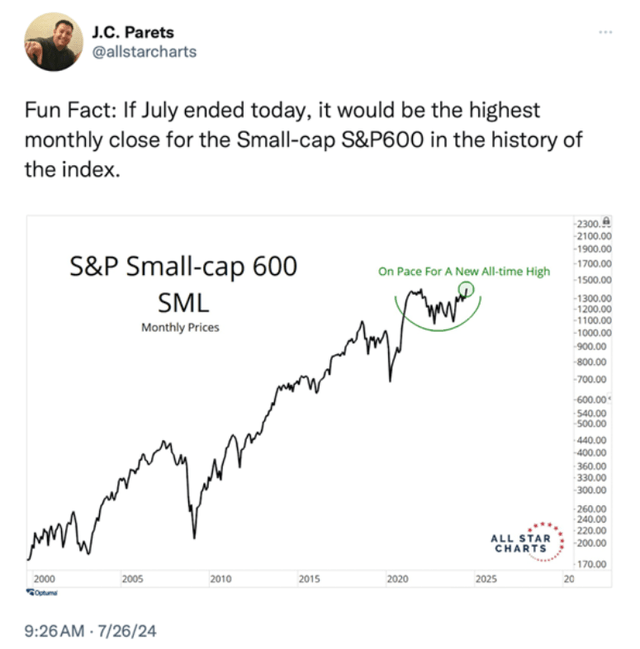
Additional proof of the small-cap “melt-up”
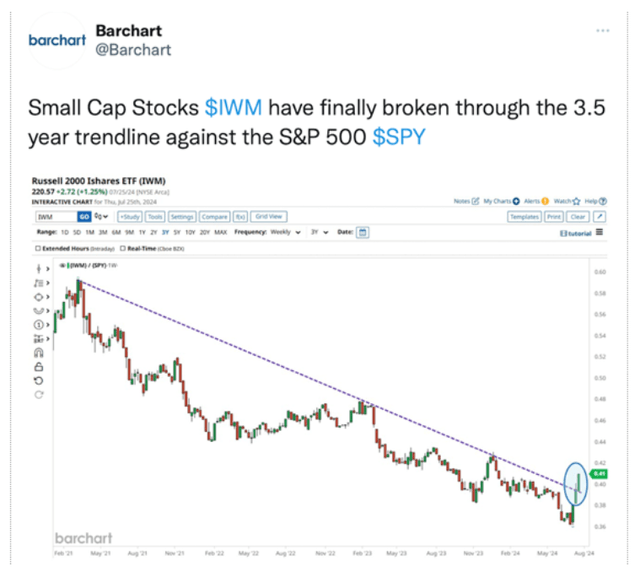
Here are some additional examples of the progress made in small-cap stocks. The small-cap index is beginning to compete against the bigger-cap indices of the S&P 500 and the tech-heavy NASDAQ (QQQ). See examples below:
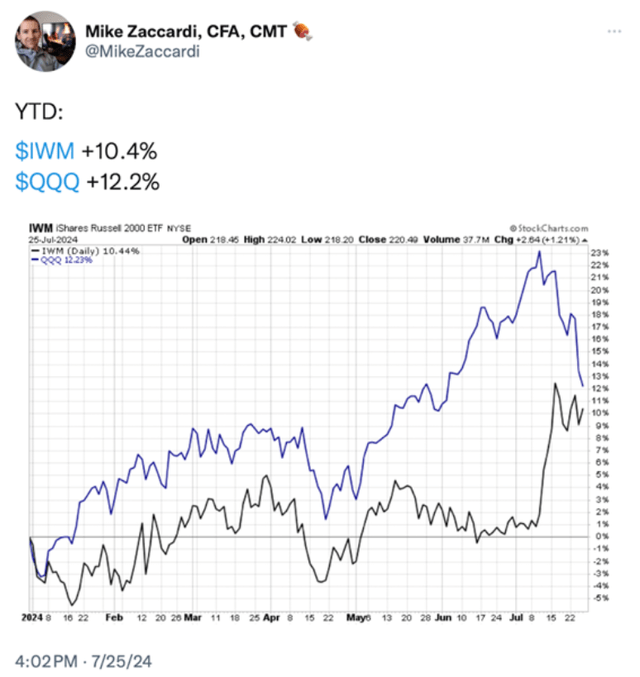
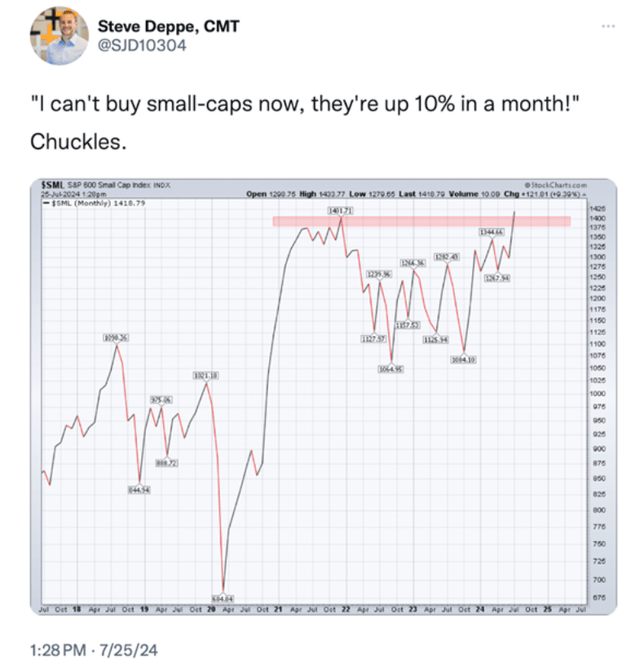
Is it too late to buy this asset class?
Given that small-cap stocks (as represented by the IWM index) are up over 10% in one month, investors are wondering, “Have I missed it? Will this asset class continue its forward progress and momentum at the breakneck speed as it has?
We do not know. But in comparing against other historical movements when small-cap stocks come back in favor, the asset class may have plenty of room to run.
Then, there are several well-known analysts like Tom Lee of Fundstrat, who has been calling for huge returns in small-cap stocks before year-end. I found it humorous when I tripped upon an illustration (below) of sarcasm by the writer in describing investors’ reluctance to purchase something that has gone up double digits so quickly. One only need be reminded of technology stocks from October 2023 to May 2024. See chart below:
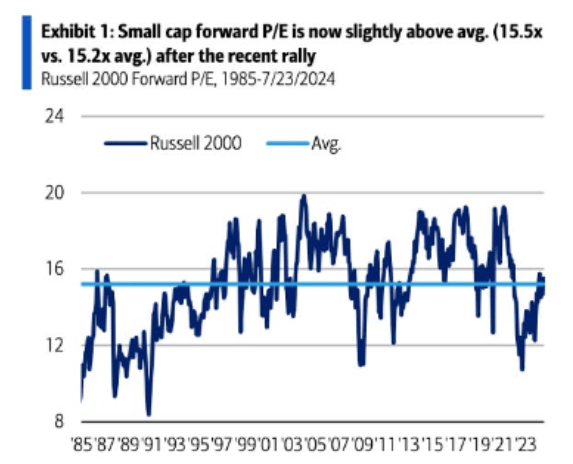
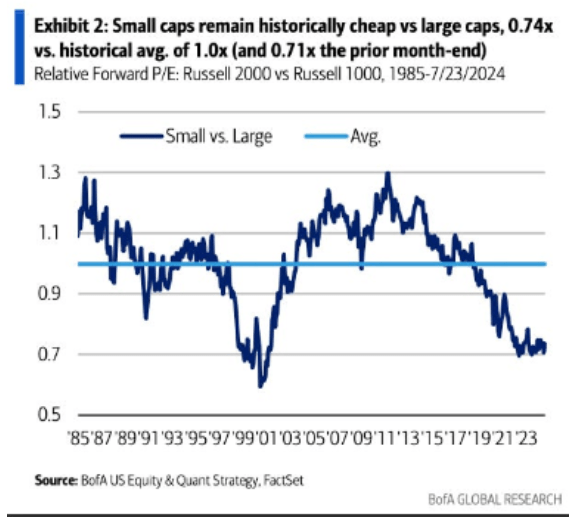
Are small-cap stocks still cheap?
That is the question that analysts on Wall Street are asking. We found the narrative and charts that follow supportive of the idea of continuing to invest in small-cap stocks.
“Russell 2000 index valuations. On an absolute basis, they are not cheap after this recent rally. But small caps remain cheap vs. large caps, trading at a 25% discount to history. Based on relative P/E of 0.74% vs. the historical average of 1.0x”
One sector that looks attractive… Financials
We have noted over the past few weeks in our market outlooks that financial stocks have been perking up. Clearly, the mere fact that the Dow Jones has seen a significant move up as money rotates into financials is evidence enough to drive home this point. The Dow Jones has several mega-cap financial firms, including JPMorgan (JPM), Goldman Sachs (GS), American Express (AXP), The Travelers Companies (TRV) and Visa (V).
While interest rates have not yet declined, the forward expectations that the overnight lending rates by the Federal Reserve are likely to come down soon (more about this in a minute) is driving money to rotate from expensive tech stocks to the more value-oriented financials, as mentioned above.
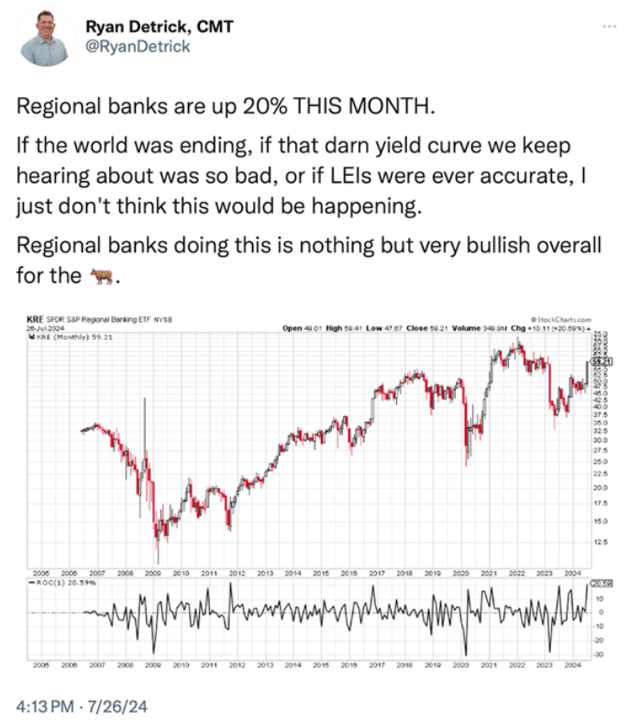
Also, within the small-cap market that we have been highlighting these past few weeks resides hundreds of smaller financial firms, including regional banks. These stocks are likely to benefit even more from any loosening of monetary policy. We note the following chart to illustrate this point:
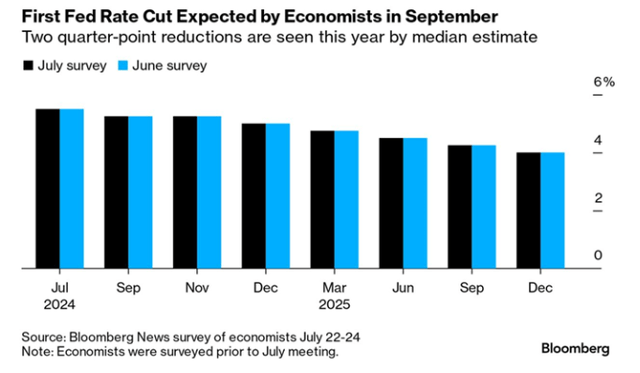
Positive expectations for Fed rate cuts were reiterated this past week
We have been illustrating, the past few weeks, that the futures betting markets continue to forecast an imminent easing by Fed Chairman Jerome Powell and company. Additional information (and charts) came out this week supporting this hypothesis.
On Friday, the PCE (Personal Consumption Expenditure) was released and showed inflation is trending down. See chart below:
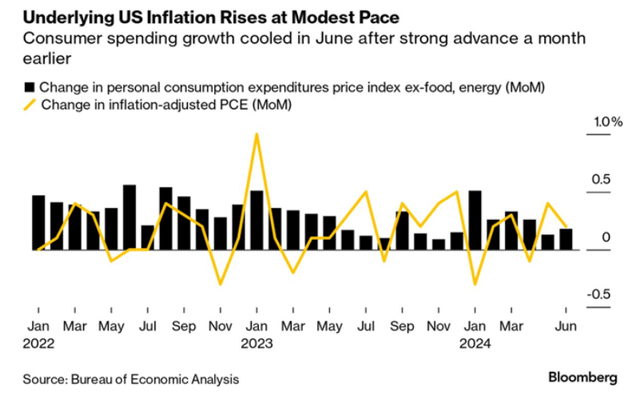
This was also repeated in the following narrative from Bloomberg late last week:
From Bloomberg: The soft landing is in sight. The Federal Reserve’s preferred measure of underlying US inflation rose at a tame pace in June and consumer spending remained healthy, all positive signs for the central bank as it seeks to cool inflation without going too far. It also bolstered investor bets the Fed will signal at its meeting next week that it intends to begin unwinding tight monetary policy in September, with a quarter point interest rate cut.
Historical comparisons of the markets with expectations going forward
We like to use empirical facts and historical comparisons to show similar situations as to when trends began, had substantial momentum ceased to exist. We like to use historical facts to make a point as to what may happen in the future.
We know all too well that the markets don’t always repeat but they do rhyme.
The following are two good comparisons that demonstrate how we may be setting up for the remainder of 2024.
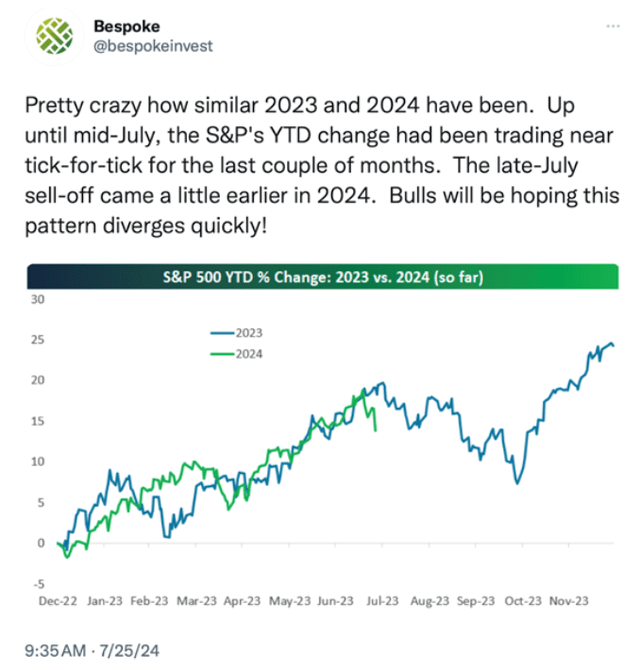
Comparison of 2023 to 2024. The bulls hope this can repeat itself:
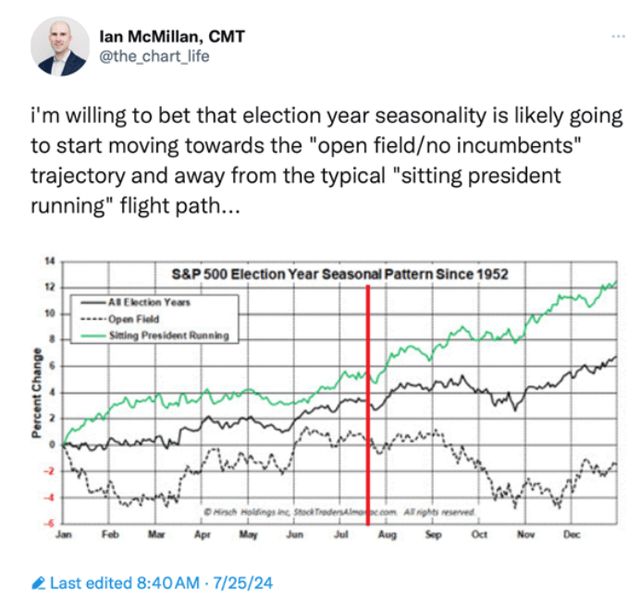
Election year seasonality, three different scenarios:
Thank you for reading this week’s market outlook. Please make sure you review the Big View bullets below which contain information to help you make profitable investment decisions.
Have an enjoyable summer week ahead. Good luck with your investments.
____________
Risk-On
- Tale of two cities with the SPY and QQQ down vs. the Dow and IWM trending up. (+)
- Weekly charts for Dow and IWM look potentially explosive. (+)
- McClellan Oscillator for both the SPY & QQQ regained a positive footing by Friday’s close. (+)
- Stocks above key moving averages held up over 50% level despite the nasty sell-off in the SPY and started to flip back up by Friday’s close and even more positive on IWM. (+)
- Value is outperforming growth on both a short- and long-term basis. Growth stocks closed in a warning phase while Value maintained its bullish trend. We consider this a healthy rotation in the markets. (+)
- With the exception of the once red-hot Semiconductors (which closed in a warning phase), the other five members of the family all closed in bull phases. (+)
- Volume patterns were strong for DIA and IWM. (+)
Neutral
- SPY had an inside day on Friday with it closing right above its 50-Day Moving Average. Both Price and Real Motion showing oversold conditions in the S&P and QQQ which closed in warning phases. (=)
- 52-Week New High / New Ratio for the S&P & NASDAQ Composite is giving a mixed read with short-term pressure while medium-term trend looks positive. (=)
- After a breakout to new all-time highs, gold had a substantial selloff but held onto its bull phase on sloppy price action, muddling its recent breakout. (=)
- Gold’s outperformance is limiting the risk gauge from turning more positive. (=)
- Sectors were mixed with hot growth sectors coming off but most sectors were positive on the week. Consumer discretionary diverged with Staples by 3%. Transports, a good indication of a growing economy, fell -1.7%. (=)
- Solar Energy and Water, along with regional banks and homebuilders, all had strong weeks. (=)
Risk-Off
- VIXY short-term volatility ran up with the market sell-off. Needs to hold 10.50 to sustain rally. (-)
- Both emerging and more established markets closed in warning phases. (-)
- Volume patterns are confirming price action with zero accumulation days for the S&P and QQQ. (-)
Editor’s Note: The summary bullets for this article were chosen by Seeking Alpha editors.
Read the full article here