


Measuring how bullish or bearish investors are is vital to investing. It can be just as important as estimating earnings or forecasting interest rates. Three well-tested sentiment indicators currently show that there are simply “too many” bullish investors. If everyone’s bullish, who’s left to buy to drive prices higher?
The Master Sentiment Indicator (MSI)
Our Master Sentiment Indicator, at 9.8, is registering one of its most extreme bullish sentiment readings in history. It’s finally reached the opposite extreme from the two, strong, -10 buy signals in July and October 2022.
The MSI Speed Dial Which Shows the Current Ranking of the MSI (The Sentiment King) The red-green chart above graphs the MSI over the last 15 years. Its ability to indicate major market lows is phenomenal, major tops less so, but we believe it’s better than any economic or financial metric in this regard. The MSI (Master Sentiment Indicator) is composed of nine classic sentiment indicators fused together using our SK ranking system. The following are the nine indicators that make up the MSI: The CBOE Total Puts and Calls Ratio, The CBOE Equity Puts to Calls Ratio, The CME Commitment of Traders data on the S&P futures, Buying in the ProShares S&P 500 Inverse Fund (SH), NAAIM Exposure Index (National Association of Active Managers), Hulbert Rating Service (Stocks), Hulbert Rating Service (Nasdaq), The AAII Sentiment Survey, and the Investors Intelligence Survey. (The Sentiment King)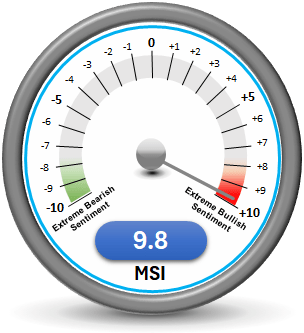
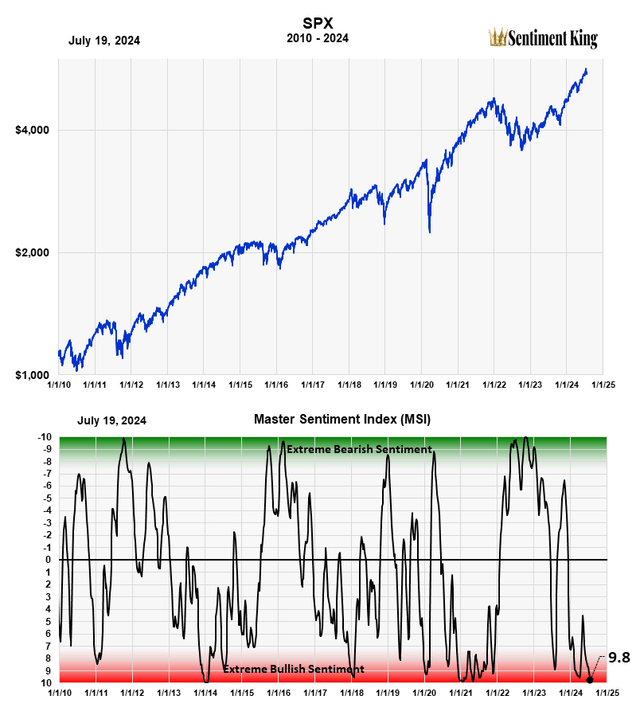
The Sentiment King’s Master Sentiment Indicator (MSI) is made by combining nine classic sentiment indicators into one. It’s graphed on the Sentiment King ranking scale, which goes from plus +10 to -10. All the indicators that go into making the MSI have extensive histories; one even goes back to 1964.
On our ranking scale, a +10 represents the highest level of bullish expectations, while -10 is the most bearish. Each number from 10 to -10 is calculated from historic data and represents a 5% change in expectation. This ranking scale allows us to evaluate and compare all the indicators on the same footing
We’ve also color-coded the scale. The Red Zone shows when indicators have reached extreme levels of bullish sentiment, while the Green Zone indicates extreme bearish sentiment. In between is a large gray area we call the Neutral Zone. It’s called “neutral” because sentiment only has meaning when it’s at extremes; in between, sentiment doesn’t tell you much. This is an important point.
The Nine Indicators That Make Up The MSI
This table shows the nine sentiment indicators that make up the MSI. The indicators are listed in the black row across the top. The MSI, which is a mathematical sum of the nine, is found in the far-right column. Five of the indicators, as well as the MSI itself, are currently in the Red Zone.
The Sentiment King MSI Table. We average each indicate over an appropriate time, then locate it on the Sentiment King ranking scale, which goes from +10 to -10. The ranking is based on where the average is against historic numbers. The ranking of all nine called the MSI is shown in the far right column. (The Sentiment King)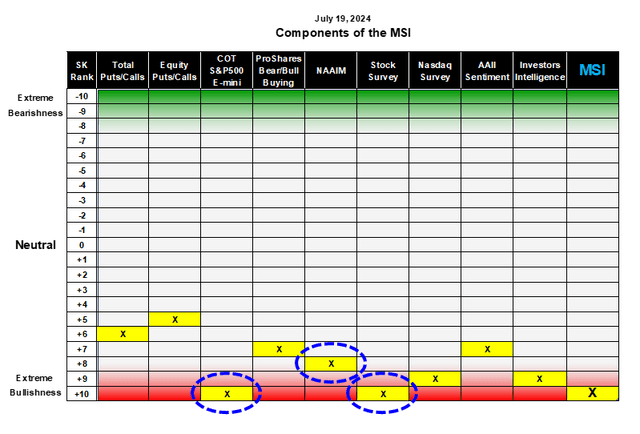
We’ve circled in blue the three indicators we want to focus on. Two are solidly in the Red Zone and the other just barely. They are:
- The S&P 500 E-mini Commitment of Traders
- The NAAIM
- The Hulbert Stock Market Survey
The S&P 500 E-mini Commitment of Traders
The Futures Commission keeps track of how many contracts various traders are long and short S&P 500 futures. They report these numbers every Friday. The best traders to monitor for insight into market price direction are the short positions of Money Managers in S&P 500 futures.
Their short selling activity acts as a contrary opinion indicator. History shows you want to be “long the market” when Money Managers are heavily short S&P futures, and “sell the market” when they’re not short selling. The chart below shows our ranking of the Money Manager’s short position of the S&P futures.
The Sentiment King Ranking of the Short Position of Money Managers in S&P 500 Futures (The Sentiment King)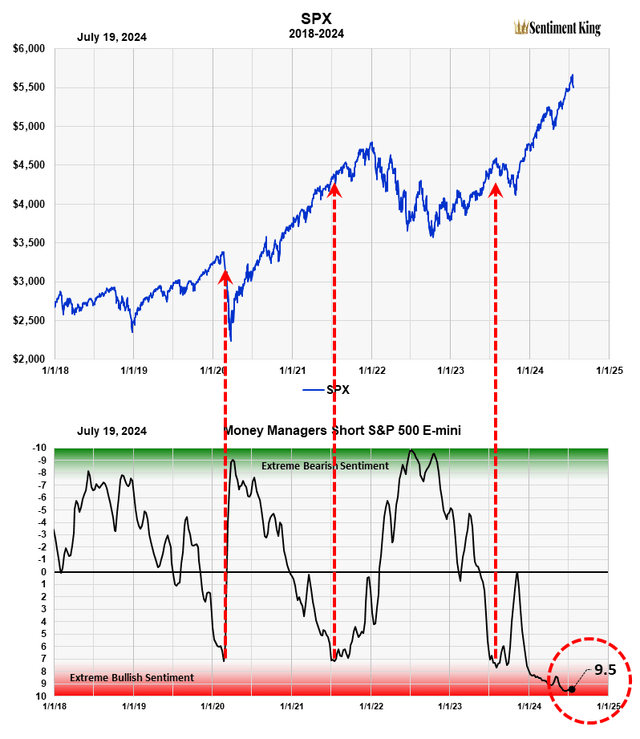
We’ve indicated with red arrows three periods when there was very little, short selling of S&P futures by money managers. Each occurred just above the Red Zone near a major market top. The current ranking of money managers is 9.5, which, as you can see, is well into the Red Zone.
At the bottom of the COVID bear market, money managers were short 1,000,000 S&P 500 E-mini contracts. Now, after the two-year bull market, they are only 200,000 contracts short, which is the lowest number since 2008. This means that Money Managers in S&P futures are as bullish now as they were before the bear market and financial crisis of 2008-09. This is why history puts this indicator so far into the Red Zone.
The S&P 500 E-mini futures market is not a small market. It’s over $500 billion. Statistically, we are dealing with a large data sample of hundreds of thousands of traders, and therefore the numbers are very meaningful. We think investors should pay close attention to what this indicator is saying.
We want to make something clear, however. Extreme sentiment readings can’t tell you the expected size of an advance or correction, only that one is probably coming. This is important.
The NAAIM Exposure Index
The National Association of Active Investment Managers, or NAAIM, calculates an exposure index based on what their member’s exposure to the stock market is. The number is the average of all reporting members. It too acts as the contrary opinion indicator, since their highest exposure occurs at market tops and their lowest exposure at bear market lows.
The Sentiment King Ranking of A three Week Average of the NAAIM Exposure Index (The Sentiment King)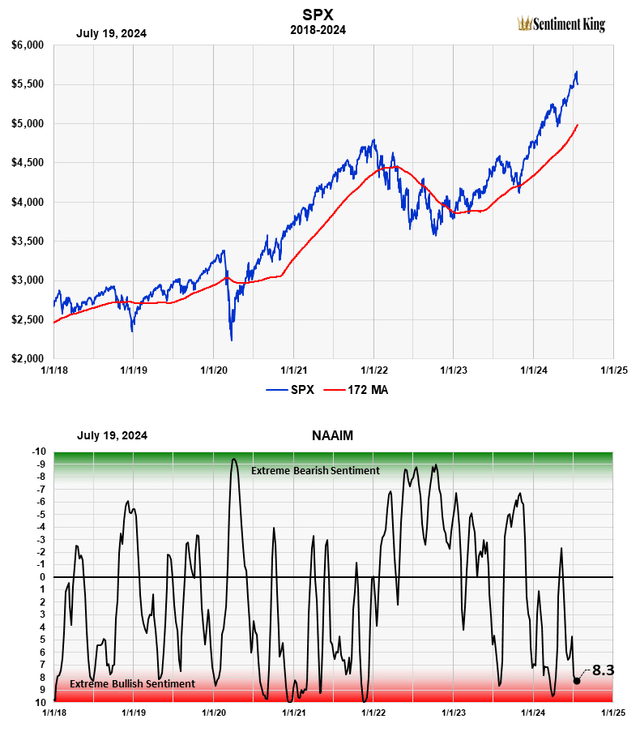
For example, at the bottom of the market in October 2022, the average active money manager was only 12% invested in the stock market. Of course, history shows one should have been 100% invested, or an even higher percent, using leverage.
In November 2021, one month before the start of the bear market, their average exposure to stocks was 107%, which meant they were fully invested with an additional 7% leverage. In hindsight, they should have had a very low exposure to protect against the coming bear market.
The chart above puts the NAAIM exposure index on our ranking scale. Our current ranking is 8.3, which is just slightly in the Red Zone. It shows their average market exposure is getting high, but has not yet reached past extremes.
The Hulbert Stock Survey
Mark Hulbert keeps track of what newsletter writers are saying about the stock market – what percent is bullish, bearish or expecting a correction. His data has a history back before 2000. We take his data and calculate a long-term moving average to gain a long-term perspective.
We take the current percent of bullish newsletter writers, compare it to bullish percents over the last 25 years and then put the results on our Sentiment King ranking scale, which is shown below.
The Sentiment Ranking of the Hulbert Survey of Newsletter Writers (The Sentiment King)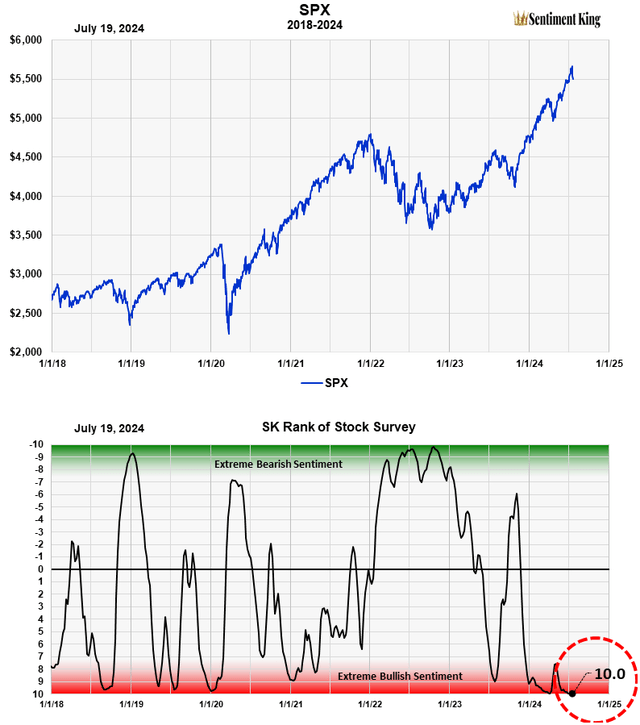
Our current ranking is 10.0, which is the highest rank possible. Newsletter writers are more bullish now than at any time in the last 25 years, a period that included some of the greatest bull and bear markets in history. As you can see, it’s been near these extreme readings now for a number of months.
To us, this is very important. We think it’s a strong indicator that a major correction is just around the corner. We want to emphasize again that extreme sentiment readings can’t tell you the size or duration of a coming advance or correction, only that one is probably coming and that it will be significant.
Summary
With the master sentiment indicator at 9.8, as well as three well established sentiment indicators also showing extreme levels of bullish sentiment, we think our forecast of a major top in the market in August is still on target.
As we’ve said, markets can’t go up much when everybody’s already bullish and from a historical perspective, we currently are at that level today.
Read the full article here