


Introduction
France-based TotalEnergies SE (NYSE:TTE) released its First-quarter 2023 earnings on April 27, 2023.
Note: I have followed TTE quarterly since 2017. This new article is a quarterly update of my article published on February 21, 2023.
1 – 1Q23 Results Snapshot
TotalEnergies reported a first-quarter 2023 adjusted net income of $2.61 per share ($6,541 million). It was well above the year-ago $3.40 realized last year ($8,977 million) due to declining commodity prices. However, earnings beat analysts’ estimates.
However, the cash from operations has dropped significantly since 3Q22, as shown below:
TTE Quarterly Cash from Operations History (Fun Trading)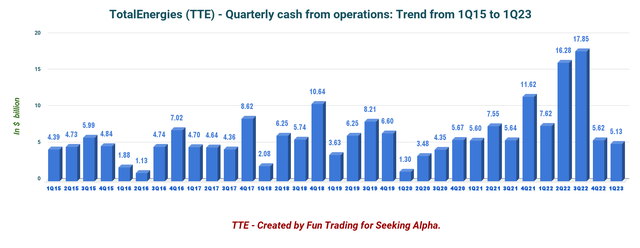
The total revenues came in at $62.603 billion, down 8.7% from $68.606 billion in the year-ago quarter due to lower commodity prices.
First-quarter upstream equivalent production averaged 2,524K Boepd, down 11.2% from 2,843K Boepd (or 2,508K Boepd excluding Novatek) realized last year. The company said the production was up 1% YoY, excluding Novatek.
For the first quarter, liquids production averaged 1,562K Bopd, up 2% from the year-ago period. Quarterly gas production was 5,191K Cfpd, down 28% year-over-year due to lower gas production from Africa, the Asia Pacific, Europe, and America.
The production of the iGRP segment excluding Novatek (Integrated Gas, Renewables, and Power) was 463K Boepd compared to 492K Boepd in 1Q22 (433K Boepd excluding Novatek).
2 – Investment Thesis
TotalEnergies SE is probably one of the safest investments in the oil sector regarding dividends. As a reminder, it was the only European oil major that did not reduce or cut dividends when the oil market collapsed a few years back. Thus, it is a very appealing stock for dividend-oriented investors.
Also, TotalEnergies SE remains a large oil and gas producer despite shifting to renewables, representing now a non-negligible growing part of its business. As a reminder, nearly one-third of its 2023 CapEx, or $5 billion, has been allocated to renewable and “green electricity generation” in 2023.
Oil and Gas prices remain the main component for TTE, and the recent retracement in price had and will impact revenue and free cash flow even if oil and gas prices increase recently a little, as we will explain later in this article.
Thus, it is essential to trade short-term LIFO for about 40%-50% of your TTE holding and keep a long-term core position for a higher target. This dual strategy entitles you to take full advantage of the oil and gas sector’s high volatility and inherent cyclicity. It is what I suggest in my marketplace, “The Gold and Oil Corner.”
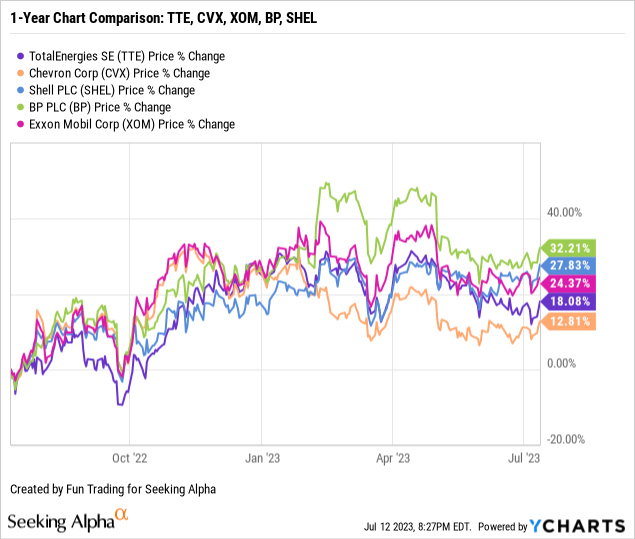
3 – Stock performance
TotalEnergies has slightly underperformed the group, which includes Shell (SHEL), U.K.-based BP (BP), as well as US major Exxon Mobil (XOM).
TotalEnergies SE is up 18% on a one-year basis.
TotalEnergies: Balance Sheet and Production history ending in 1Q23: The Raw Numbers
Note: TTE is an American Deposit Receipt or ADR. The Foreign withholding taxes reduce the dividend paid to American investors is 12.8%. However, the foreign tax paid can be deducted from your income tax. Sometimes, your broker charges you 25%, but I believe it is a mistake. Ask your Financial Adviser about your case.
| TotalEnergies SE | 1Q22 | 2Q22 | 3Q22 | 4Q22 | 1Q23 |
| Total Revenues in $ Billion | 68.61 | 74.77 | 69.04 | 68.58 | 62.60 |
| Total Revenues (minus excise tax) in $ Billion | 63.95 | 70.45 | 64.96 | 63.95 | 58.23 |
| Net income in $ Billion | 4.94 | 5.69 | 6.63 | 3.26 | 5.56 |
| EBITDA $ Billion | 14.90 | 14.98 | 16.49 | 12.99 | 13.60 |
| EPS diluted in $/share | 1.85 | 2.16 | 2.56 | 1.26 | 2.21 |
| Cash from operating activities in $ Billion | 7.62 | 16.28 | 17.85 | 5.62 | 5.13 |
| Capital Expenditures in $ Billion | 3.46 | 5.15 | 2.99 | 4.10 | 4.97 |
| Free Cash Flow in $ Billion | 4.16 | 11.13 | 14.86 | 1.52 | 0.165 |
| Total Cash $ Billion | 38.69 | 40.71 | 47.63 | 41.77 | 35.52 |
| Long-term Debt in $ Billion | 64.80 | 62.87 | 61.82 | 60.77 | 60.80 |
| Dividend per share in €/sh (including tax 12.8%) |
0.69€ |
0.69€ |
0.69€ |
0.69€ + 1.00€ special dividend |
0.74€ |
| Shares outstanding (diluted) in Billion | 2.644 | 2.611 | 2.588 | 2.510 | 2.492 |
| Oil Production | 1Q22 | 2Q22 | 3Q22 | 4Q22 | 1Q23 |
| Oil Equivalent Production in K Boepd | 2,843 | 2,738 | 2,669 | 2,812 | 2,524 |
| Americas Production in K Boepd | 386 | 420 | 449 | 442 | 441 |
| Average price liquids $/Boe | 90.1 | 102.9 | 93.6 | 80.6 | 73.4 |
| Average gas price $/Mbtu | 12.27 | 11.01 | 16.83 | 12.74 | 8.89 |
Source: Company filings and Fun Trading.
Analysis: Balance sheet and production discussion
1 – Total revenues were $62.603 billion (including excise tax) in 1Q23
TTE Quarterly Revenue History (Fun Trading)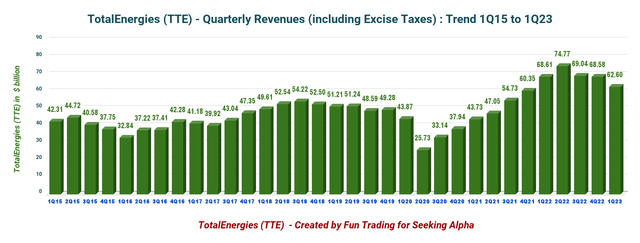
TotalEnergies’ revenues came in at $62.603 billion (including the excise taxes) or $58.233 billion net, significantly down from the $68.606 billion generated in the year-ago quarter. The company indicated a profit of $2.21 per diluted share and adjusted net income was $6.5 billion in 1Q23 compared to $9 billion in 1Q22.
Net earnings were $5,557 million, up from $4,944 million in 1Q22. The net operating income was $6,993 million, down about 26% from the year-ago period due to lower commodity prices.
TotalEnergies acquired assets worth $3,256 million and sold assets worth $269 million in 1Q22, mainly related to the sale of 50% of the
2 – Trailing 12-month free cash flow (“ttm”) was $27.68 billion with $0.165 billion in 1Q23
TTE Quarterly Free Cash Flow History (Fun Trading)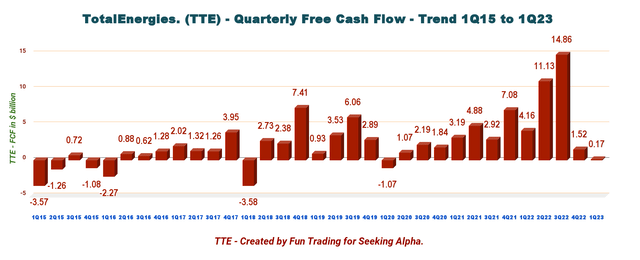
TotalEnergies trailing 12-month free cash flow is now $27.682 billion, with $0.165 billion realized for 1Q23.
Cash flow from operating activities at the first quarter-end was $5,133 million, down from $7.62 billion in the year-ago period.
TTE paid a quarterly dividend of €0.74 per share in the first quarter of 2023, or a dividend yield of 5.02%.
The company intends to buy back up to $2 billion worth of TTE shares in 2Q23.
3 – Net debt was $25.28 billion as of the end of March 2023
TTE Quarterly Cash versus Debt History (Fun Trading)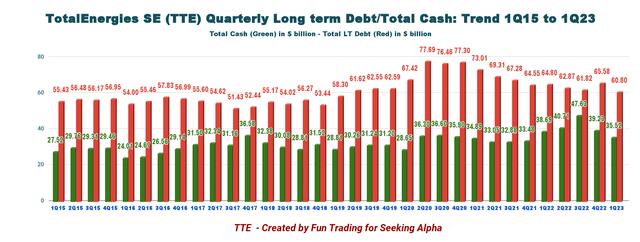
As of March 31, 2023, cash and cash equivalents were $35,520 million compared with $38,691 million in 1Q22.
The debt-to-equity ratio is now 0.526, according to YCharts. Net debt to capital was 11.5% at the end of the first quarter of 2023 compared with 12.7% at the end of the fourth quarter of 2022.
Using another method, TTE indicates a net debt of $15.35 billion ($17.053 billion in 1Q22). I have done a more general calculation from the LT Debt, including current minus total cash, which is a more comparable value with other oil majors.
4 – Details: TTE operates four different segments
TTE Quarterly Adjusted Income per Segment 1Q22 versus 1Q23 (Fun Trading)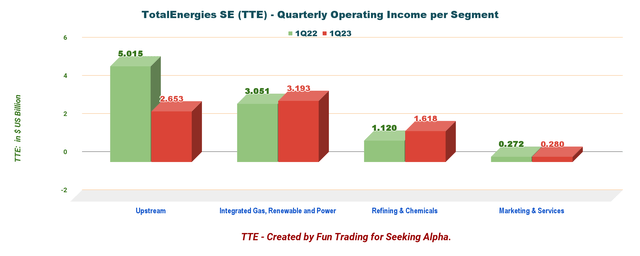
4.1 – Exploration & Production (Upstream)
The operating gain was $2,653 million, down significantly from $5,015 million last year.
4.2 – Integrated Gas, Renewable, and Power
Operating income was $370 million.
4.3 – Refining and Chemicals
Operating income was $1,618 million from $1,120 million in the year-ago quarter.
4.4 – Marketing and Services
Operating income was $280 million, up from $272 million in 1Q22.
5 – 2Q22 Oil Equivalent Production up to 2,524K Boepd from 2,843K Boepd (or 2,532K Boepd excluding Novatek) last year.
TTE Quarterly Oil Equivalent Production History (Fun Trading)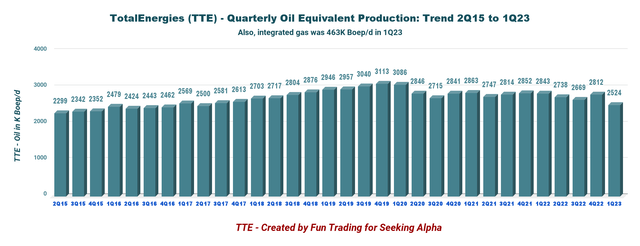
Total hydrocarbon production during the first quarter of 2023 averaged 2,524K Boepd, down from 2,843K Boepd in the same quarter the previous year.
However, it is better to compare the 1Q23 production with the 1Q22 production, non-including Novatek or 2,508K Boepd.
This quarter’s average realized liquids prices were $73.4, down 18.5% from the year-ago price. NG prices were $8.89, down from $12.27 per thousand British thermal units last year. LNG price was $13.27 per Bbl, up 2.4% YoY.
TTE Quarterly Liquid and NG Prices History (Fun Trading)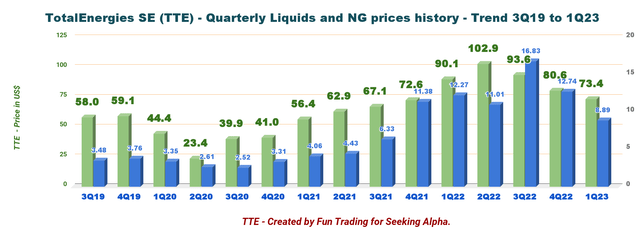
Upstream output comes primarily from Europe and the Middle East. TotalEnergies SE has a small production from the Americas.
TTE Quarterly Production per Region 1Q23 (Fun Trading)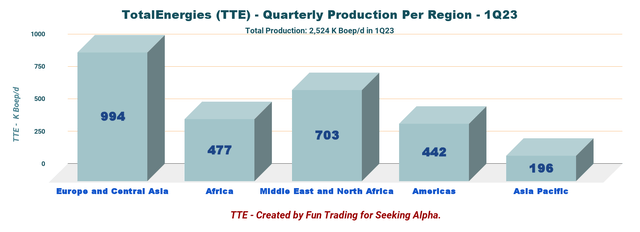
For the first quarter, liquids production averaged 1,562K Boepd, up 2% YoY. Quarterly gas production was 5,191K cfp/d, down 28% from last year due to lower gas output.
6 – 2023 Outlook
TotalEnergies expects second-quarter 2023 hydrocarbon production to be approximately 2,500K Boepd, roughly the same amount produced in 1Q23.
Also, the LNG sales are expected to increase with the restart of Freeport LNG and a higher utilization rate of refineries after the end of strikes in France.
TotalEnergies expects a CaPex of $16 billion in 2023, of which $5 billion will be allocated to renewable operations and electricity.
TTE intends to buy back stocks worth $2 billion in 2Q23.
Technical Analysis and Commentary
TTE TA Chart Short-term (Fun Trading StockCharts)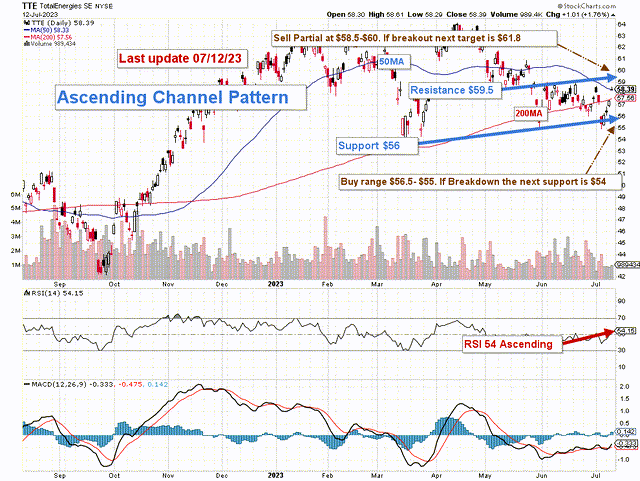
TTE forms an ascending channel pattern with resistance at $59.5 and support at $56.
Ascending channel patterns or rising channels are short-term bullish in that a stock moves higher within an ascending channel, but these patterns often form within longer-term downtrends as continuation patterns. The ascending channel pattern is often followed by lower prices.
However, TTE is highly correlated to oil and gas prices which have deteriorated regularly on a one-year basis – especially Natural gas prices – which have continued to deteriorate in the past three months despite some signs of support recently after Saudi Arabia and Russia extended cuts in oil supply significantly.
The Saudi Energy Ministry said it would extend July’s cut of 1 million barrels per day through August to support “the stability and balance of oil markets.” That will keep the Gulf nation’s output at 9 million barrels per day.
TTE 1-Year Chart Brent and NG price (Fun Trading StockCharts)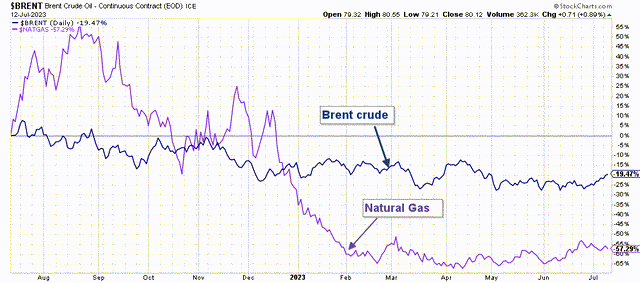
Thus, the trading strategy is to sell about 40%-50% of your position LIFO between $58.5 and $60 with possible higher resistance at $61.8 and wait for a retracement between $56.5 and $55 with potential lower support at $54.
Warning: The TA chart must be updated frequently to be relevant. It is what I am doing in my stock tracker. The chart above has a possible validity of about a week. Remember, the TA chart is a tool only to help you adopt the right strategy. It is not a way to foresee the future. No one and nothing can.
Editor’s Note: This article discusses one or more securities that do not trade on a major U.S. exchange. Please be aware of the risks associated with these stocks.
Read the full article here