


Among innumerable investment strategies, there are two that might look entirely antithetical at first blush. These are strategies focusing on either momentum or value. Momentum-based investment philosophy essentially means chasing hot themes, with a key premise being stock prices rising ad infinitum. Value style takes a wholly different stance, digging deeper for underappreciated, mispriced names, with enough patience to wait until the market realizes its mistake, finally rewarding these value picks with the multiples they deserve.
However, despite looking totally antithetical, a mix of both could produce rather interesting results at times. The VictoryShares International Value Momentum ETF (NASDAQ:UIVM) leverages such a hybrid strategy based on an index designed to select reasonably priced ex-U.S. developed-world names with momentum characteristics. The strategy is also mindful of volatility and turnover. I strongly recommend reading the prospectus to understand the nuances. UIVM has a reasonable 35 bps expense ratio, with a fairly large AUM at about $245 million.
It is essential to note that the fund underwent changes in the past. According to its website, incepted in October 2017, it initially tracked the MSCI World ex USA Select Value Momentum Blend Index with the name VictoryShares USAA MSCI International Value Momentum ETF before switching to the Nasdaq Victory International Value Momentum Index in November 2022. It was renamed as a consequence. The UIVM website provides the following description of the index:
The Index ranks each stock based on its value and momentum scores, relative to their sector classification, and creates a composite score for each stock by equally weighting the stock’s value and momentum score. The Index then selects the top 25% and weighs them such that securities with lower realized volatility are given higher Index weights. The Index will rebalance quarterly.
Changes might seem cosmetic as the developed world value/momentum focus was maintained, yet there is a serious shift in terms of country exposure, e.g., Korean equities became eligible for inclusion. More on that shortly.
With 240 stocks in the portfolio, UIVM offers a good-looking representation of the developed world equity universe. Below is the sample consisting of its key ten holdings (8.1% of the portfolio) as of June 28.
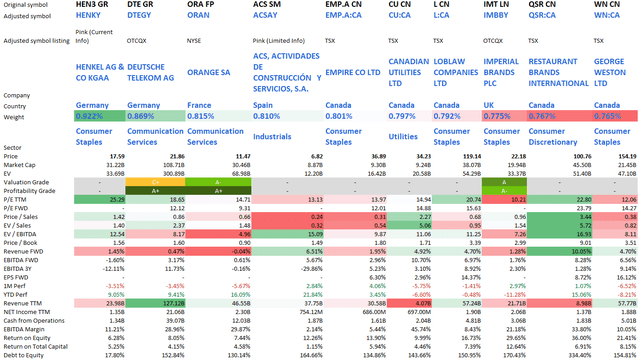
Created by the author using data from Seeking Alpha and the fund
Please take notice that figures are in the US$ except for Canadian securities that have all their metrics in the CA$. Besides, since most names in the group have weak liquidity over the counter in the U.S., price return data shown might differ significantly from returns companies delivered on their exchanges of primary listing.
A nice example to mention here is Henkel AG & Co. KGaA (OTCPK:HENKY) (Xetra ticker: HEN3), a Düsseldorf-based consumer staples heavyweight operating via the Adhesive Technologies and Consumer Brands segments after its business structure was simplified, with Beauty Care and Laundry & Home Care merged, a decision discussed on page 17 of the annual report. On Xetra, the stock has a one year price return of 22%, which with dividends included adds up to over 25%. At the same time, HENKY rose by only ~12.3%, with the euro’s last year softness as a ripple effect of U.S. monetary policy to blame.
Looking at the 25.3x Price/Earnings ratio, which is even higher than the one of the S&P 500 index (about 21.8x), investors might suggest Henkel does not offer a compelling value story. However, it should not be reviewed in isolation. Truly, there is some expansion on the P/E front, with the contributors being its IFRS earnings decline since its profit touched a 5-year high in September 2018 as Henkel tackled opex headwinds and its share price appreciation; as a consequence, Henkel’s P/E has solidly advanced since hitting a 5-year low of ~15.6x in March 2020. Contrarily, P/S has even become leaner, now at about 1.4x compared to 2.2x in mid-2018. And its EV/EBITDA of 12.5x juxtaposed to the consumer staples sector median of 13.5x looks adequate. So while valuation is acceptable, what I dislike about Henkel is its weakening cash earnings as the Net CFFO/Net income ratio has shrunk from the 2020 level of 2.2x to about 1x as of end-2022 (indicative of a working capital issue and perhaps some pressure on the top line), a situation similar to the one seen in 2018, yet back then, the firm had much stronger IFRS earnings.
Besides, revenue and EBITDA growth is not Henkel’s strongest side, but this is hardly a coincidence for a consumer staples heavyweight. Looking at other holdings in the table above, it becomes evident that growth is likely weak also portfolio-wise, with the mid-single-digit rates at best (Restaurant Brands International (QSR:CA) is an outlier), again hardly a coincidence for a value-focused mix.
Speaking of value, the UIVM equity basket is truly inexpensive as its website shows the LTM P/E at 11.1x as of May 31; for context, the iShares MSCI EAFE ETF (EFA) which targets certain developed markets had 14.1x as of June 28.
Looking at the top 10 group, my dear readers might suggest UIVM is overweight in Canadian stocks, and, hence, its CAD exposure makes the mix inherently sensitive to commodity prices as the currency has historically been influenced by petroleum in addition to other factors like the central bank’s view on interest rates and inflation. However, this would be a hasty conclusion.
The reality is that UIVM was overweight Japanese names that accounted for 26.4% as of May 31. Looking inside the fund’s daily holdings file available on its website, I found 88 equities with a JP code, accounting for 23.8% of the portfolio, with Nippon Telegraph and Telephone Corporation (OTCPK:NTTYY) (Tokyo ticker: 9432) being the largest position in this group, with a 41 bps weight; however, NTT is only in 110th place in this portfolio. Obviously, the Fed’s next moves are of certain importance as they impact the yen, which has been under pressure amid this hiking cycle. Meanwhile, Canadian stocks (with a CN code) that occupy the top spots in the portfolio have just an 8.8% combined weight.
It is also of note that the fund has exposure to Korean stocks that account for close to 9%. To clarify, the debate on whether South Korea is a developed or an emerging market is still not over, with MSCI having an opinion that the country belongs in the EM cohort. And the fund likely had no exposure to it before the strategy change as the MSCI World index targets only developed countries.
Regarding sectors, the key ten stock cohort is dominated by consumer staples, yet financials (16.9%) and industrials (15.9%) were the key allocations as of end-May, with consumer staples accounting for only 9.8%; again, nothing surprising here as financials tend to trade at a discount to other industries.
Final thoughts
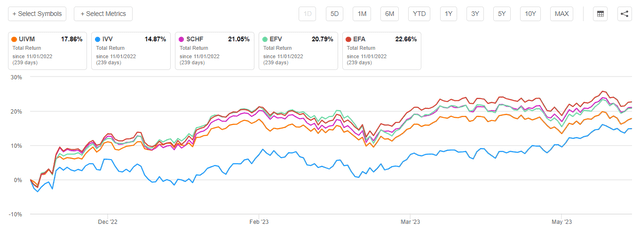
Despite being overall constructive on UIVM, I would still stop short of a bullish thesis. The ETF offers exposure to notable overseas value/momentum stories, but its past performance suggests the strategy is not as powerful as it might seem. Certainly, an issue here is that the data prior to November 2022 should be taken with a grain of salt as Korean equities were not eligible for the portfolio, which could have affected returns. Nevertheless, I believe it is worth reviewing the total returns since its inception anyway because the developed world value/momentum focus did not change. The data below are for the November 2017 – May 2023 period, with the funds selected for comparison being EFA, the Schwab International Equity ETF (SCHF), iShares MSCI EAFE Value ETF (EFV), and iShares Core S&P 500 ETF (IVV).
| Portfolio | IVV | UIVM | SCHF | EFA | EFV |
| Initial Balance | $10,000 | $10,000 | $10,000 | $10,000 | $10,000 |
| Final Balance | $17,899 | $9,777 | $11,925 | $11,869 | $10,649 |
| CAGR | 10.99% | -0.40% | 3.20% | 3.12% | 1.13% |
| Stdev | 17.91% | 17.20% | 17.53% | 17.41% | 18.95% |
| Best Year | 31.25% | 15.29% | 22.24% | 22.03% | 15.78% |
| Worst Year | -18.16% | -17.43% | -14.79% | -14.35% | -14.66% |
| Max. Drawdown | -23.93% | -32.88% | -27.49% | -27.58% | -33.18% |
| Sharpe Ratio | 0.59 | -0.02 | 0.18 | 0.18 | 0.07 |
| Sortino Ratio | 0.88 | -0.03 | 0.26 | 0.25 | 0.1 |
| Market Correlation | 1 | 0.87 | 0.89 | 0.89 | 0.81 |
Created by the author using data from Portfolio Visualizer
The results are hardly inspiring as UIVM lagged drastically, with the weakest annualized return in the group. Another problem here is that UIVM has underperformed all the developed world ETFs I selected since the index change in November 2022.
Seeking Alpha
In summary, UIVM is a Hold at best.
Read the full article here