


Recently, I wrote a review of the iShares Ultra Short-Term Bond ETF (ICSH), discussing the pros and cons of these ‘near-cash investments’. This article takes a look at a competitor fund to the ICSH ETF, the SPDR SSgA Ultra Short Term Bond ETF (NYSEARCA:ULST).
Overall, I find the ULST ETF more expensive than its peers, has weaker performance, and pays a lower distribution yield. I would avoid the ULST ETF.
Fund Overview
The SPDR SSgA Ultra Short Term Bond ETF is an actively managed ETF that seeks to provide income from a portfolio of short-term U.S.-dollar denominated investment grade securities with a goal of outperforming cash. The ULST ETF is managed by SSGA’s Fundamental Active Fixed Income Team and is meant to compete directly with other ‘near-cash’ investments like the PIMCO Enhanced Short Maturity Active Exchange-Traded Fund ETF (MINT), the JPMorgan Ultra-Short Income ETF (JPST), and the iShares Ultra Short-Term Bond ETF (ICSH) (Figure 1).
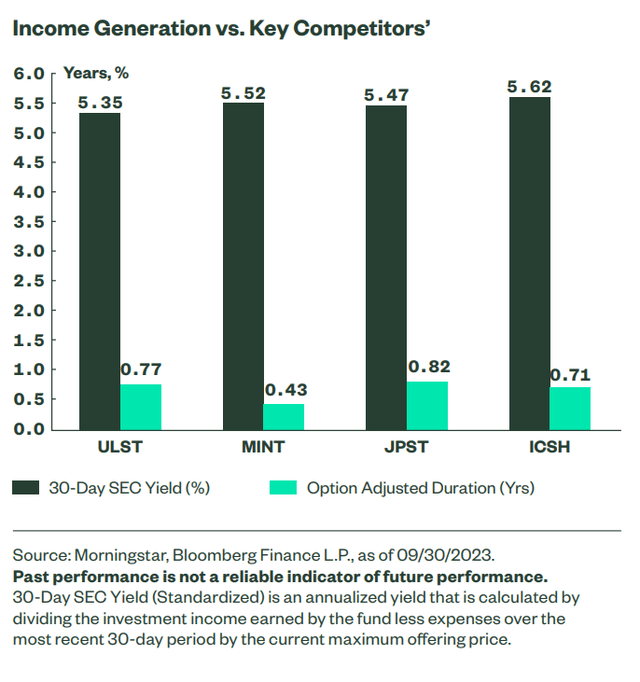
Figure 1 – ULST is meant to compete with ‘near-cash’ investment funds (ULST highlights)
The ULST ETF has $618 million in assets and charges a 0.20% expense ratio.
Portfolio Holdings
Figure 2 shows the portfolio overview of the ULST ETF. The ULST ETF holds 172 investments in its portfolio with a portfolio option adjusted duration of 0.79 years and an average yield to maturity of 6.21% (Figure 2).
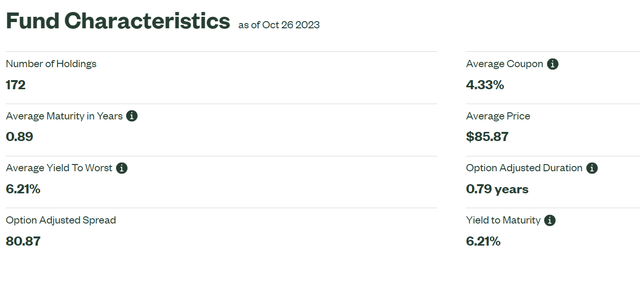
Figure 2 – ULST overview (ssga.com)
Figure 3 shows the sector allocation of the ULST ETF as of October 26, 2023. It holds a variety of short-term bonds from Financial Institutions (27.6%) and Industrial companies (26.8%), as well as treasuries (17.6%) and short-term investment funds (“STIF”, 14.0%).
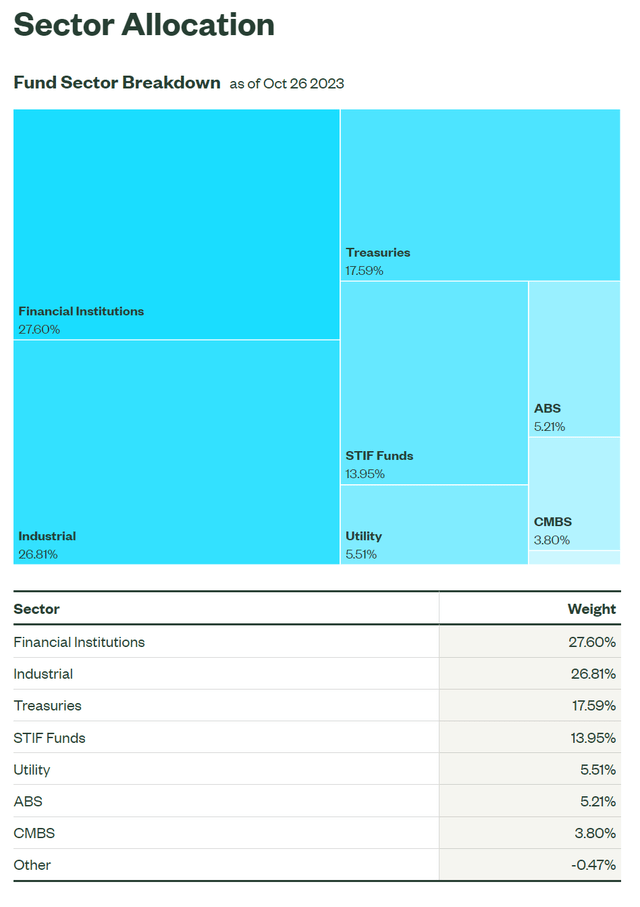
Figure 3 – ULST fund sector breakdown (ssga.com)
Figure 4 shows the credit quality allocation of the ULST ETF, with 31.7% A-rated, 25.4% BBB-rated, 20.9% AA-rated, and 7.4% AAA-rated.
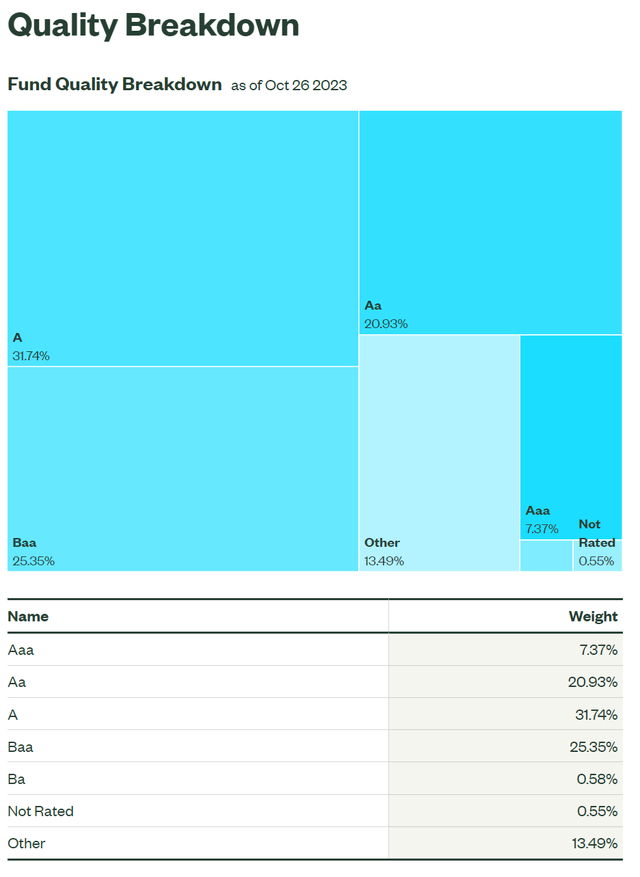
Figure 4 – ULST’s investments are primarily IG rated (ssga.com)
Finally, Figure 5 shows the maturity profile of the ULST ETF. The fund is primarily invested in securities that mature within 1 year (65.9%) or 1-2 years (21.1%).
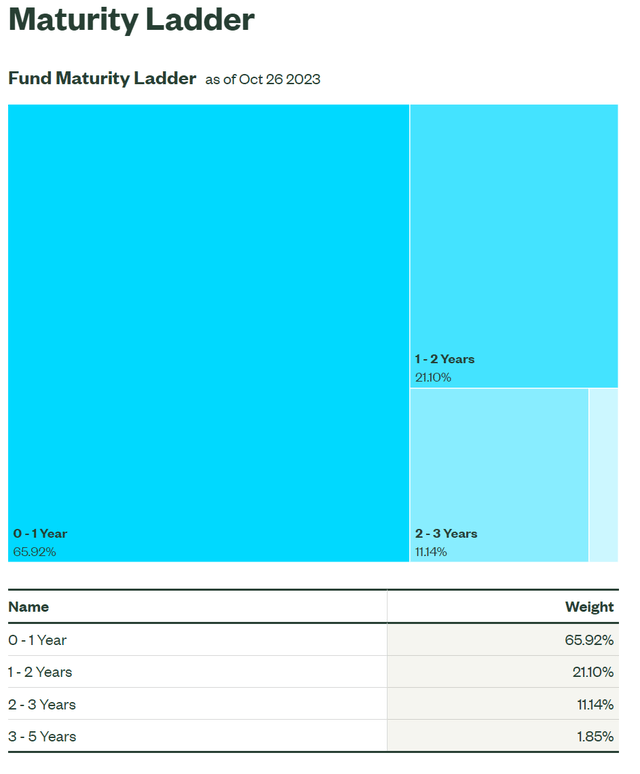
Figure 5 – ULST maturity allocation (ssga.com)
Distribution & Yield
The ULST ETF pays a trailing 12-month distribution yield of 4.02% and has a 30-Day SEC yield of 5.41% as of October 26, 2023 (Figure 6).
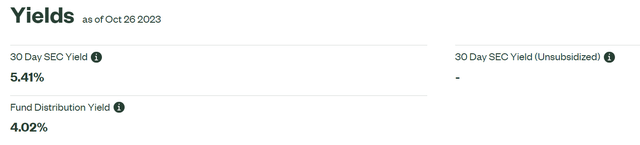
Figure 6 – ULST distribution yield is 4.02% (ssga.com)
Its most recent monthly distribution of $0.1593 / share annualizes to 4.75%.
Returns Consistent With Capital Preservation
Figure 7 shows the historical returns of the ULST ETF. It has delivered modest 1/3/5Yr average annual total returns of 4.8%/1.7%/1.9% respectively to September 30, 2023.
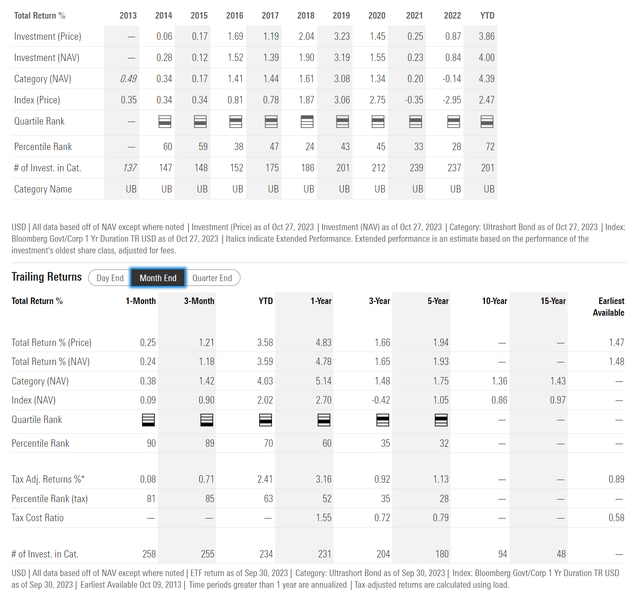
Figure 7 – ULST historical returns (morningstar.com)
Consistent with its capital preservation mandate, the ULST ETF has not lost money on an annual basis since inception.
However, similar to its peer funds MINT, JPST, and ICSH that I have written about previously, these ‘near-cash’ investment funds all have varying levels of credit risk and duration risk. So in effect, investors are trading off modest amounts of risk for a slightly higher distribution yield.
For example, in a rising interest rate environment like in 2022, the modest duration risk of the ULST ETF becomes a drag on performance, causing the ULST ETF to underperform a money market fund like Fidelity Government Money Market Fund Other (SPAXX). ULST returned 0.8% in 2022 compared to 1.3% for SPAXX (Figure 8).
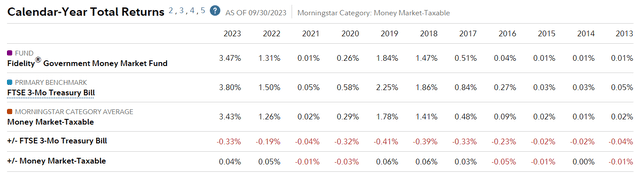
Figure 8 – SPAXX historical returns (fidelity.com)
But Beware Market Crashes
Furthermore, near-cash funds like the ULST can become dislocated during market crashes as credit spreads blow out. For example, during the COVID pandemic, the ULST ETF briefly plunged to steep mark-to-market loss (Figure 10).
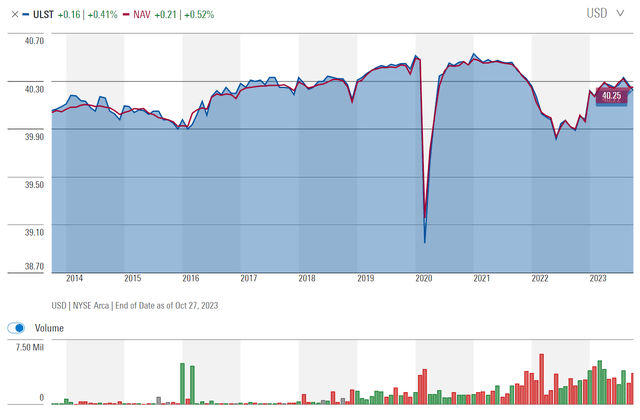
Figure 10 – ULST had large MTM losses during COVID-pandemic (morningstar.com)
Although ultimately the ULST ETF recovered, for investors who need access to cash during volatile times, this could mean a haircut on supposedly safe ‘cash’ investments.
Comparing ULST To Peers
Comparing ULST to its peers, we can see that the ULST ETF is the smallest of the group, with only $0.6 billion in assets. It is also on the expensive side, charging a 0.2% expense ratio (Figure 11).
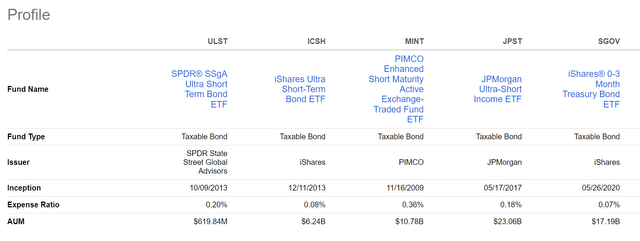
Figure 11 – ULST vs. peers, fund structure (Seeking Alpha)
A high expense ratio could be justified if the ULST ETF delivers superior returns. However, that does not appear to be the case, as the ULST ETF has weak total returns on a 1yr and 3yr basis compared to peers (Figure 12 and 13)
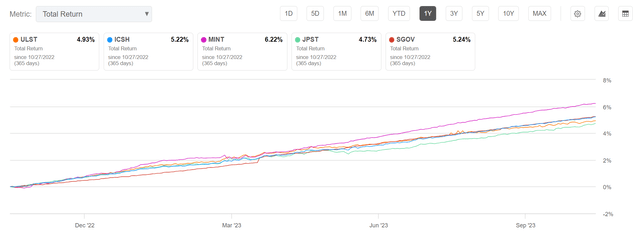
Figure 12 – ULST vs. peers, 1-year total return (Seeking Alpha)
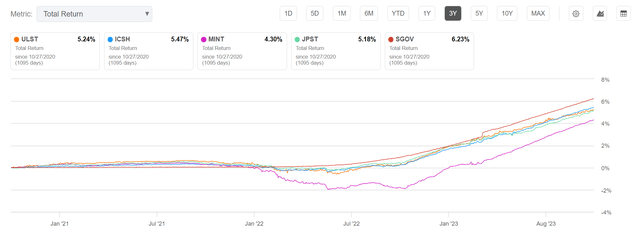
Figure 13 – ULST vs. peers, 3-year total return (Seeking Alpha)
The ULST ETF also has the lowest trailing 12-month distribution yield, at just 4.02% (Figure 14).
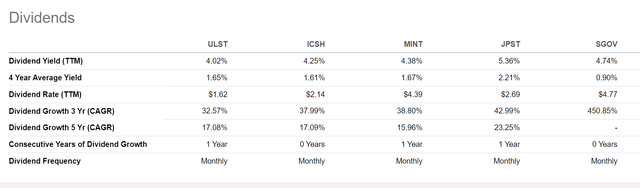
Figure 14 – ULST vs. peers, distribution yield (Seeking Alpha)
On an annualized basis, ULST’s most recent monthly distribution annualizes to 4.75% compared to 4.79% for ICSH, 5.40% for MINT, 5.07% for JPST, and 4.91% for SGOV.
Overall, I do not see any reason why investors should prefer the ULST ETF compared to the other ‘near-cash’ alternatives, as it is more expensive, with weaker historical returns and lower distribution yields.
Cash Should Be Cash
For me personally, I continue to recommend investors consider the safety of treasury bills for their cash allocation. Treasury bills have zero credit risk and little duration risk if held to maturity. With treasury bills now offering a competitive ~5% yield, the modest duration and credit risk associated with ‘near cash’ investments like ULST is hard to justify.
I currently hold the iShares 0-3 Month Treasury Bond ETF (SGOV) and the WisdomTree Floating Rate Treasury Fund ETF (USFR) as my ‘cash’ holdings. SGOV has a 30-Day SEC yield of 5.18% and is paying an annualized 4.91% on its latest monthly distribution, while USFR has a 30-Day SEC yield of 5.41% and is paying an annualized 5.39% on its most recent distribution.
Conclusion
The SPDR SSgA Ultra Short Term Bond ETF is an actively managed ETF in the ‘near-cash’ market segment. It is meant as a cash replacement tool for investment portfolios, offering higher yields than money market funds while preserving capital.
While ‘near-cash’ investments perform like ‘cash’ during most scenarios, investors should be mindful that it is not truly devoid of risks. For example, in rising interest rate environments like 2022, small duration risks have caused the ULST ETF to underperform treasury bills. Furthermore, when markets become dislocated, these ‘near-cash’ investments can also suffer MTM losses, which defeats the purpose of cash.
Comparing ULST to its peer funds, I do not see any areas where the ULST ETF is superior. It is more expensive, has weaker historical returns, and lower distribution yields. If investors are adamant about holding these ‘near-cash’ investments, I suggest they consider the peer funds instead. I rate ULST a sell.
Read the full article here