


What is Return on Capital Employed?
The Return on Capital Employed (ROCE) is a financial ratio that can be used to measure the profitability of a company or how efficiently it utilizes its capital to generate returns. A few weeks ago I wrote an article about using ROCE to generate alpha with Dividend Aristocrats, you can view that article here. The article also provides a better primer on ROCE and a fantastic quote from Charlie Munger that explains why this metric is very important.
The formula for ROCE is straightforward, it’s Earnings Before Interest and Taxes (EBIT) divided by Total Assets less Current Liabilities.
After reviewing the application of ROCE with Dividend Aristocrats I wanted to test it on a more growth-oriented subset of stocks. I decided to look at the constituents of the popular Invesco QQQ ETF (NASDAQ:QQQ) that tracks the Nasdaq 100 Index. The initial results were different than what I expected, but I was able to identify simple patterns that led to substantially improved long-term returns.
Before I dive in and summarize the outcome of the 4 theories tested let me briefly explain the testing process. When you look for correlations in a dataset you have to be careful to not only find patterns that yield the results you are seeking but ones that are also based on logic. Correlation does not imply causation and a theory must logically make sense, as well as lead to a desired outcome for it to be considered sound. I started with the most basic assumptions and extrapolated from there, testing variations of the same parameters all the while considering whether the changes I am applying to the filters make conceptual sense.
There are 100 unique stocks in the QQQ ETF, many have strong histories of ROCE while some presented negative returns as they have not yet become profitable. My initial observation was that despite not being profitable several of these 100 stocks still generated pretty favorable returns. I believe this divergence in correlation between fundamental performance and market returns is driven by optimistic sentiment investors place on growth stocks with the assumption that they will become highly profitable in the future. This was not the case with the Dividend Aristocrats as most of them are mature businesses with strong track records of consistent results.
The time period for my test was between 2013 and June of 2023. The performance results were tested between 2014 or 2015 and June of 2023, depending on the assumptions for a given theory. The total return for QQQ since 2014 was 356.28% or a 17.49% CAGR. The total return since 2015 was 282.85% or a 15.32% CAGR.
Given that I tested the current roster of stocks in the ETF, not all of which existed for the entirety of the test period, the benchmark returns for my theories are measured against an equal-weighted allocation to all 100 tested stocks since 2014, 2015 or their inception.
Since 2014 all 100 stocks generated a total return of 678.22% or a 24.35% CAGR. Since 2015 all 100 stocks generated a total return of 520.35% or a 24.22% CAGR. Pretty similar long-term CAGRs for both time periods, also both are significantly superior to the return generated by QQQ.
Let me preface the following sections with a minor spoiler, only 3 of the following 4 theories led to superior results.
Theory 1: Best R.O.C.E.
Theory number 1 is the simplest application of ROCE. I sorted all 100 stocks based on their ROCE at the end of each calendar year and selected iterations of 5 stocks with the highest ROCE value. The table below summarizes the results.
| Range | 2023 | 2022 | 2021 | 2020 | 2019 | 2018 | 2017 | 2016 | 2015 | 2014 | Total Return | Annualized |
| All | 22.91% | -18.90% | 30.31% | 70.22% | 45.50% | 5.89% | 37.79% | 19.20% | 10.87% | 25.45% | 678.22% | 24.35% |
| Top 5 | 9.35% | -25.84% | 36.39% | 51.90% | 36.53% | 18.33% | 19.59% | 20.12% | 15.62% | 27.17% | 473.31% | 20.38% |
| Top 10 | 15.74% | -19.38% | 33.38% | 39.82% | 52.62% | 8.11% | 21.55% | 15.96% | 15.01% | 22.80% | 471.57% | 20.34% |
| Top 15 | 20.42% | -19.76% | 31.49% | 35.30% | 54.93% | 6.85% | 22.84% | 13.37% | 10.00% | 22.45% | 433.73% | 19.46% |
| Top 20 | 23.06% | -21.71% | 31.48% | 39.23% | 55.58% | 2.32% | 37.14% | 16.13% | 11.38% | 20.68% | 501.01% | 20.98% |
| Top 25 | 24.67% | -20.83% | 32.03% | 34.68% | 52.07% | 0.44% | 34.24% | 14.98% | 10.82% | 23.23% | 465.09% | 20.19% |
| Top 30 | 25.58% | -21.06% | 38.20% | 51.10% | 48.13% | 0.01% | 36.07% | 14.17% | 9.49% | 25.16% | 552.82% | 22.05% |
| QQQ | 39.14% | -32.58% | 27.42% | 48.40% | 38.96% | -0.12% | 32.66% | 7.10% | 9.45% | 19.18% | 356.28% | 17.49% |
As you can see none of the iterations was able to generate a better total return compared to owning all 100 stocks. I found this a bit surprising, logically I expected stocks with higher ROCEs to generate better returns compared to stocks with lower ROCEs. This was the case with the Dividend Aristocrats, albeit this theory led to only a minor improvement in the total return it was an improvement nevertheless.
While achieving a CAGR of 20% over a 9.5 year period of time is nothing to complain about. The additional work of tracking and applying this filter with no alpha is pointless. Onto the second theory.
Theory 2: Best Improvement in R.O.C.E.
Theory number 2 looked at the best improvement in ROCE compared to the prior year. Since this test required two ROCE values to measure the initial change in ROCE, the test period had to be trimmed to begin in 2015. Again I tested iterations of 5 stocks, starting with the 5 best stocks and working my way to the top 30. The table below summarizes the results.
| Ranges | 2023 | 2022 | 2021 | 2020 | 2019 | 2018 | 2017 | 2016 | 2015 | Total Return | Annualized |
| All | 22.91% | -18.90% | 30.31% | 70.22% | 45.50% | 5.89% | 37.79% | 19.20% | 10.87% | 520.35% | 24.22% |
| Top 5 | 23.27% | -42.40% | 2.33% | 240.57% | 111.05% | 38.09% | 52.88% | 2.13% | -6.29% | 955.13% | 32.31% |
| Top 10 | 30.11% | -28.10% | 22.45% | 154.79% | 104.36% | 30.38% | 55.00% | 24.89% | 6.32% | 1500.46% | 39.02% |
| Top 15 | 32.12% | -29.02% | 24.00% | 124.85% | 87.38% | 11.75% | 52.98% | 20.87% | 1.91% | 931.67% | 31.95% |
| Top 20 | 33.77% | -26.97% | 24.94% | 102.81% | 71.35% | 9.90% | 50.07% | 20.86% | 2.79% | 769.05% | 29.29% |
| Top 25 | 30.30% | -26.17% | 27.10% | 116.59% | 68.43% | 9.92% | 50.10% | 21.65% | 1.67% | 810.23% | 30.00% |
| Top 30 | 26.89% | -25.76% | 29.30% | 108.88% | 64.47% | 8.90% | 45.57% | 20.77% | 4.54% | 737.51% | 28.72% |
As you can see the results are much more favorable for this theory, with each iteration of 5 stocks generating a superior return compared to all 100 stocks.
The best outcome was presented by identifying the top 10 stocks with the largest improvement in ROCE each year. This allocation led to a total return of 1,500.46% or a phenomenal 39.02% CAGR. That’s nearly 3 times the total return generated by all 100 stocks. If you look at the returns for each individual calendar year you can see that this strategy would have led to very high volatility. The variance in returns appears to be higher with fewer stocks chosen and tends to align better with the entire universe of 100 stocks as we move closer to the top 30 selections. This was expected as more concentrated portfolios tend to diverge more from their benchmark.
The level of alpha generated by this theory is high enough to warrant the risk of testing it in real life. The theory makes logical sense as companies that see an improvement in their ROCE tend to be on the upswing and this strategy essentially piggybacks on that momentum run.
Theory 3: Growing R.O.C.E.
Theory number 3 is an expansion of theory number 2 except here I wanted to apply a threshold to the improvement in ROCE. I wanted to test if targeting stocks that saw a specific level of improvement in their ROCE led to superior results. I tested a range of improvements to see if I could find a sweet spot but one that also made rational sense, the range tested was between 5% and 20% improvement in the value of ROCE. I was only able to apply the test up to 17%, at this level there were not enough stocks meeting this criteria to select at least 1 stock per year. I also didn’t think it would be wise to have a strategy with such a concentrated allocation. The best outcome was generated using a threshold of 10%, yielding on average 9 stocks selected per each calendar year. The results are summarized in the table below.
| Range | 2023 | 2022 | 2021 | 2020 | 2019 | 2018 | 2017 | 2016 | 2015 | Total Return | Annualized |
| All | 22.91% | -18.90% | 30.31% | 70.22% | 45.50% | 5.89% | 37.79% | 19.20% | 10.87% | 520.35% | 24.22% |
| Selected | 27.25% | -26.17% | 10.19% | 211.55% | 109.22% | 45.28% | 61.79% | 29.02% | 6.58% | 2080.75% | 44.23% |
With the exception of 2015, 2021 and 2022 the strategy led to sizable outperformance. The total return for this 8.5 year test period was also nearly 4 times higher compared to owning all 100 tested stocks, with an impressive CAGR of 44.23%.
Theory 4: Growing and Stable R.O.C.E.
The 4th and final theory tested is another expansion, this time of theory number 3. The initial filter for selection remained the same, a 10% increase in the value of ROCE from year to year. The expansion here was that if a stock was chosen in any given year it could also be included in the subsequent year if it save at least a 10% improvement in their ROCE. This may be better explained with an actual example.
In 2013 Texas Instruments (TXN) had an ROCE of 16.39%, in 2014 their ROCE improved to 26.53%. This was an increase in ROCE of 10.14% which was higher than the 10% filter to meet condition number 1. In 2016 their ROCE improved again to 30.82% which was an increase in ROCE of 4.29%, not meeting the 10% increase filter. However filter number 2 allowed inclusion if the ROCE improved by 10% from the prior year. Comparing the 2016 and 2015 ROCEs (30.82% and 26.53%) we can measure the percentage change as 16.17% (30.82% – 26.53% / 26.53% = 16.17%), meeting the second condition and allowing TXN to be included in the selections for 2017.
The inclusion of the 2nd filter expanded the average number of selected stocks from 9 in theory number 3 to 11 in theory number 4. The table below summarizes the results.
| Range | 2023 | 2022 | 2021 | 2020 | 2019 | 2018 | 2017 | 2016 | 2015 | Total Return | Annualized |
| All | 22.91% | -18.90% | 30.31% | 70.22% | 45.50% | 5.89% | 37.79% | 19.20% | 10.87% | 520.35% | 24.22% |
| Selected | 29.91% | -24.87% | 11.29% | 211.55% | 106.56% | 34.41% | 81.19% | 44.07% | 6.58% | 2514.08% | 47.36% |
As you can see this theory led to the highest improvement in total return. Compared to theory number 3 we have a 3% improvement in the CAGR that led to a 434% improvement in the total return.
Constituent Stocks That Present the Best R.O.C.E. Opportunity Right Now
Applying the filters used in theory number 4, that led to the best long-term return, to the most current trailing twelve-month ROCEs for the 100 stocks that comprise QQQ only presents 2 stocks that pass the test. They are:
Verisk Analytics, Inc. (VRSK)
| Year | ROCE | Change | Return | |
| 2023 | 33.18% | 10.63% | 28.56% | |
| 2022 | 22.55% | 4.96% | -22.33% | |
| 2021 | 17.59% | 1.95% | 10.85% | |
| 2020 | 15.63% | 0.81% | 39.90% | |
| 2019 | 14.83% | -3.43% | 37.91% | |
| 2018 | 18.26% | 1.01% | 13.58% | |
| 2017 | 17.26% | -2.29% | 18.27% | |
| 2016 | 19.55% | 1.78% | 5.58% | |
| 2015 | 17.77% | -22.42% | 20.03% | |
| 2014 | 40.19% | 10.56% | -2.54% | |
| 2013 | 29.63% | 28.94% | ||
| Average | 22.40% | 17.16% |
Created by Author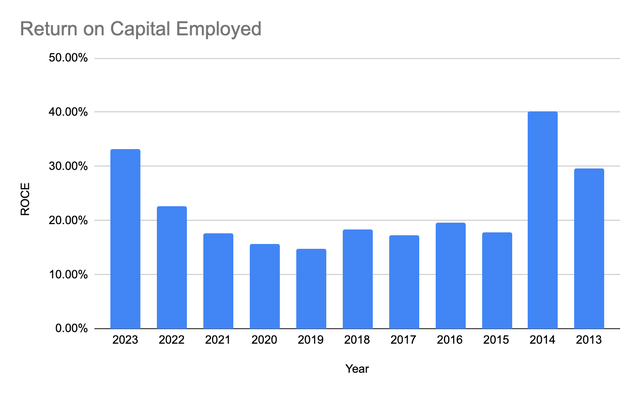
Booking Holdings, Inc. (BKNG)
| Year | ROCE | Change | Return | |
| 2023 | 36.39% | 7.36% | 33.99% | |
| 2022 | 29.03% | 13.83% | -16.00% | |
| 2021 | 15.21% | 12.46% | 7.72% | |
| 2020 | 2.75% | -30.58% | 8.45% | |
| 2019 | 33.33% | 5.41% | 19.24% | |
| 2018 | 27.92% | 7.22% | -0.88% | |
| 2017 | 20.69% | -1.96% | 18.53% | |
| 2016 | 22.66% | 2.40% | 14.99% | |
| 2015 | 20.25% | -2.75% | 11.82% | |
| 2014 | 23.00% | -4.00% | -1.91% | |
| 2013 | 27.00% | 87.37% | ||
| Average | 23.48% | 17.60% |
Created by Author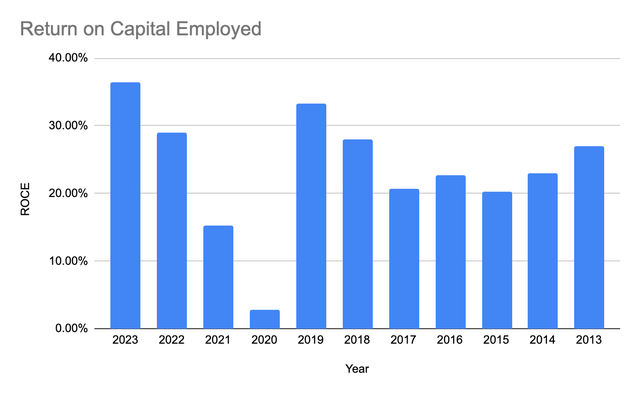
Final Thoughts
I am captivated by the application of ROCE in the stock selection process, especially given the correlation between improvement in ROCE and superior long-term returns. I’ve only begun to scratch the surface here, testing a very small subset of the stock market, but I intend to expand on this analysis. Perhaps the next step is to test quarterly data points that could identify improvement in ROCE faster. Additionally, I want to figure out the best universe of companies ROCE applies to, possibly those where long-term returns are highly correlated with historical ROCE values.
An interesting tidbit I will leave you with today is that only 2 of the 100 tested stocks had a better total return than theory number 4, between 2015 and June of 2023. The first was Nvidia (NVDA) with a total return of 8,683.63% or a 69.30% CAGR. The second was Advanced Micro Devices, Inc. (AMD) with a total return of 4,166.19% or a 55.51% CAGR. Theory number 4 bested companies such as Tesla (TSLA), Amazon (AMZN), Netflix (NFLX), META (META) and the other 92 QQQ member stocks.
Read the full article here