


Investment Thesis
Vanguard’s Small-Cap Growth Index Fund ETF Shares (NYSEARCA:VBK) warrants a buy rating due to the macroeconomic environment for small-cap growth heading into next year, the fund’s specific qualities compared to peers, and multiple promising holdings contained within the fund. While VBK is not the highest-performing small-cap ETF historically, the fund is the most diversified with the lowest expense ratio.
Fund Overview and Compared ETFs
VBK is an ETF that seeks to track the CRSP U.S. Small Cap Growth Index. With its inception in 2004, it is a well-established fund with $29.1B in AUM. The fund is highly diversified with 641 holdings and top sector weights in technology (22.10%), industrials (19.80%), and consumer discretionary (16.20%).
Other small-cap growth funds used for comparison purposes are SPDR S&P 600 Small Cap Growth ETF (SLYG), Invesco S&P SmallCap Momentum ETF (XSMO), and iShares S&P Small-Cap 600 Growth ETF (IJT). SLYG has a lower weight on information technology and attempts to match the total performance of the S&P SmallCap 600 growth index. XSMO also tracks the S&P SmallCap 600 index but includes holdings with the highest “momentum scores”. IJT seeks to track small-cap U.S. equities in general that exhibit growth characteristics.
The Case for Small-Cap Growth
Small-cap stocks have had a bad reputation in recent years. This has predominantly been because of their underperformance. While the S&P 500 index has yielded a 5-year CAGR of roughly 12%, the S&P 600, Standard & Poor’s tracking of small-sized companies between a $250M and $2B market cap, has only provided a 5.59% CAGR.
It should come as no surprise that most of the S&P 500 index’s performance in 2023 came from big tech stocks. The “magnificent seven” finished 2023 up between 53% (Apple) and 239% (Nvidia). However, small caps have not always underperformed. In fact, as illustrated in the charts below, the rolling average for small caps is superior. Given the macroeconomic conditions next year, including the expected reduction in interest rates, I argue that small caps are due for a comeback. Additionally, small-cap advocates would argue that their greatest strength is additional “room to grow” over large caps. Now, I am certainly not selling my large-cap stocks and ETFs in exchange for small caps entirely. However, I have recently added small-cap growth to gain additional exposure heading into 2024.
Small-Cap Historic Return Rate Comparison (Furey Research Partners, obtained from www.brownadvisory.com)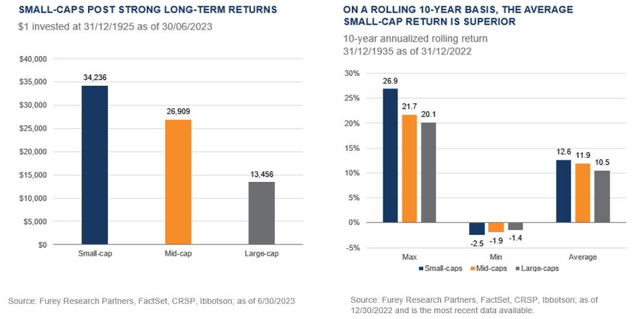
Interestingly, small-cap stocks beat large cap in 2016, an election year. This performance was thought to be due to expected tax cuts and reduced regulation. With another election year looming and the anticipated reduction in interest rates, small-cap could have another good year in 2024. While the S&P 500’s performance in 2016 was 11.96%, the S&P 600’s performance was 24.72%. If you are convinced that small cap could be a good opportunity to look forward, let’s look at VBK in comparison to some peer ETFs.
Performance, Expense Ratio, and Dividend Yield
VBK has seen a 10-year CAGR of 7.01%. This slightly underperforms the 10-year CAGR of all three other small-cap ETFs compared: SLYG (7.72%), XSMO (8.95%), and IJT (8.34%). Although VBK has underperformed compared to its peers, a bright spot is its expense ratio. At only 0.07%, VBK has the lowest expense ratio of all small-cap growth funds compared. Additionally, VBK has had very strong 2023 performance with some promising holdings looking forward. I will cover more on that later.
10-Year Total Price Return: VBK and Peer ETFs (Seeking Alpha)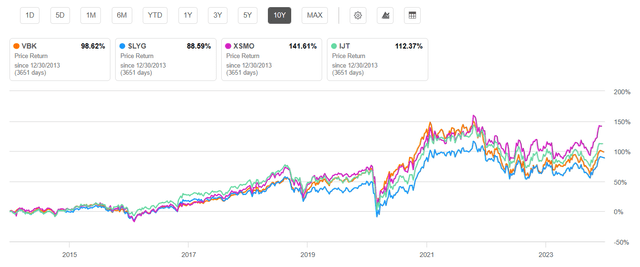
As expected with any growth-focused ETF, the dividend yield for all small-cap growth ETFs is minimal. VBK had a 0.67% dividend yield over the past 12 months with a 5-year dividend CAGR of 6.55%. This is lower than all other small-cap growth ETFs examined.
Expense Ratio, AUM, and Dividend Yield Comparison
|
VBK |
SLYG |
XSMO |
IJT |
|
|
Expense Ratio |
0.07% |
0.15% |
0.39% |
0.18% |
|
AUM |
$29.05B |
$3.08B |
$270.20M |
$5.65B |
|
Dividend Yield TTM |
0.67% |
1.16% |
0.95% |
1.01% |
|
Dividend Growth 5 YR CAGR |
6.55% |
11.41% |
21.85% |
11.38% |
Source: Seeking Alpha, 29 Dec 23
VBK Holdings and Its Competitive Advantage
Because of the different tracked indexes, the holdings for VBK compared to the other examined funds vary significantly. The other peer ETFs have top holdings in e.l.f Beauty, Inc. (ELF), a cosmetics company, ATI Inc. (ATI), a materials company, and SPS Commerce, Inc. (SPSC), an IT software company.
Top 10 Holdings for VBK and Peer ETFs Examined
|
VBK – 641 holdings |
SLYG – 343 holdings |
XSMO – 113 holdings |
IJT – 362 holdings |
|
TRGP – 0.95% |
ELF – 1.36% |
ELF – 4.29% |
ELF – 1.36% |
|
PTC – 0.83% |
SPSC – 1.23% |
ATI – 2.67% |
SPSC – 1.22% |
|
AXON – 0.70% |
FN – 1.22% |
MTH – 2.51% |
FN – 1.22% |
|
ENTG – 0.70% |
AIT – 1.15% |
SPSC – 2.48% |
AIT – 1.15% |
|
DECK – 0.67% |
MTH – 1.10% |
NSIT – 2.45% |
MTH – 1.10% |
|
VRT – 0.63% |
ENSG – 1.09% |
ACLS – 2.36% |
ENSG – 1.09% |
|
EXAS – 0.61% |
ATI – 1.01% |
AIT – 2.15% |
ATI – 1.00% |
|
FWONK – 0.61% |
MLI – 0.92% |
AAON – 2.15% |
XTSLA – 0.97% |
|
GGG – 0.61% |
DV – 0.89% |
BMI – 2.14% |
MLI – 0.92% |
|
SMCI – 0.61% |
BCC – 0.87% |
MHO – 2.09% |
DV – 0.89% |
Source: Multiple, compiled by author on 29 Dec 23
While VBK is highly diversified with 641 holdings, it has several with strong potential small caps in its top 10. Promising holdings within VBK are Axon Enterprise, Inc. (AXON), Deckers Outdoor Corporation (DECK), and Super Micro Computer, Inc. (SMCI). While the fund has low weight on each of these due to its diversification, these three are indicative of a well-managed fund.
Tech Company AXON: Strong Growth and Profitability
The first key favorable ingredient for VBK is AXON. The technology company produces devices and products for law enforcement and the military. AXON has seen very strong growth with 36.9% YoY revenue growth and 148% YoY EBITDA growth. The company is also highly profitable with a 61% gross profit margin and 16% levered FCF margin. AXON’s leadership aspires to achieve a revenue of at least $2B in 2025, which would be a 20% top line annual growth rate.
Footwear and Apparel Company DECK: Solid Momentum
The second difference is DECK. As a credit to this company’s performance, its share price is up 73% YTD. The company has seen 14% YoY revenue growth, a 52% gross profit margin, and a 15.7% net income margin. With increasing brand recognition, the company is expecting an even stronger 2024 and is primed for solid growth looking forward.
High Performance Server Company SMCI: Favorable Valuation
The third strong holding is SMCI. The company has surpassed expectations with a 22.9% YoY revenue growth and forward YoY EBITDA growth of 44.9%. SMCI has seen a huge YTD return at 239%. Despite its solid recent performance, it is also favorably valued with a forward P/E GAAP of 19.51, 33% lower than its sector median.
Valuation and Risks to Investors
VBK is currently trading at $241.77 at the time of writing this article. This is slightly below its upper 52-week range limit of $246.18 and notably below its all-time high of $304.20 seen back in November 2021. YTD, VBK has done well compared to peers. At 21.6%, VBK’s performance is close to XSMO and also superior to peers SLYG and IJT.
Year-to-Date Price Return: VBK and Competitors (Seeking Alpha)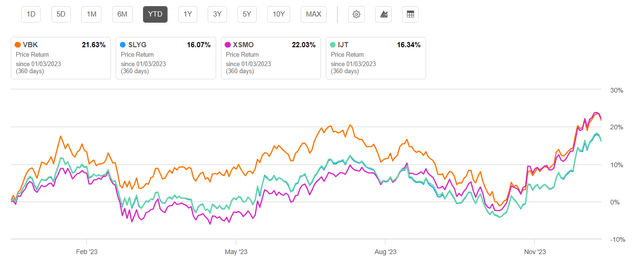
On a lower note, VBK demonstrates the least favorable valuation metrics compared to peer ETFs. At a P/E ratio of 25.6, VBK has the highest ratio compared to SLYG, XSMO, and IJT. Additionally, its P/B ratio is the highest at 3.5 compared to other small-cap growth ETFs.
Valuation Metrics for VBK and Peer Competitors
|
VBK |
SLYG |
XSMO |
IJT |
|
|
P/E ratio |
25.6 |
15.52 |
13.57 |
15.31 |
|
P/B ratio |
3.5 |
2.59 |
2.63 |
2.78 |
Source: Compiled by Author from Multiple Sources, 29 Dec 23
Despite its comparatively high valuation metrics, VBK warrants a buy for me due to its strong holdings. Small-cap growth is well postured heading into next year given the expected reduction in interest rates and the recent underperformance of small caps. Therefore, I expect VBK and peer small-cap growth ETFs to do notably better than their previous 5-year CAGR.
Small-cap funds, including VBK, are notoriously more sensitive than large cap. This is true both in recoveries and recessionary periods. This volatility can be measured with their beta values. Compared to the Dow Jones U.S. Total Stock Market Index, VBK has a beta value of 1.1 and is therefore more volatile than “the market” overall. Therefore, while I believe VBK is a buy looking forward, one can still expect a fair amount of volatility.
Concluding Summary
VBK warrants a buy rating due to its strong mix of holdings, high diversification, and low expense ratio. While the fund has underperformed two other peer small-cap growth ETFs, its YTD performance is indicative of the fund’s turnaround. Small-cap growth has recently underperformed the S&P 500 index and large-cap stocks. However, looking back at the long-term historic trend, small caps are likely due for a comeback.
Read the full article here