


Summary
Vanguard Information Technology Index Fund (NYSEARCA:VGT) is one of the largest ETFs in the sector with US$38bn in AUM, behind (QQQ) with US$195bn. VGT does not track the Nasdaq 100 (NDX) it’s missing Alphabet (GOOG), Meta (META) and Amazon (AMZN) for example. It does have a very high weight in Apple (AAPL) and Microsoft (MSFT) that combined make up 40% of the portfolio. The rest of the holdings are in the semiconductor, cybersecurity, cloud and software sectors. I analyzed VGT from a bottom-up perspective, using consensus estimates to attain upside potential, growth and valuation.
In the two charts below one can see the impact that an overweight in Apple and Microsoft has garnered. VGT beat the NDX since inception and especially in the last 10 years.
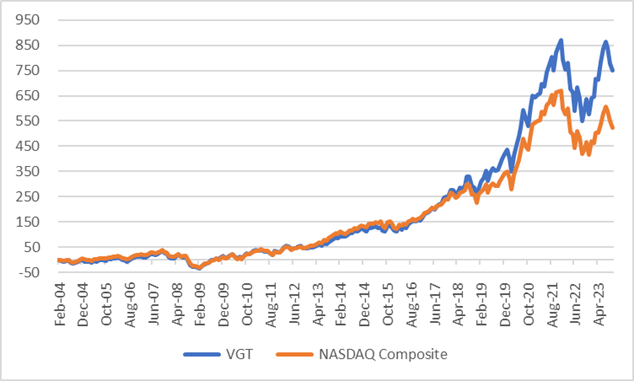
VGT vs NDX (Created by author with data from Capital IQ)
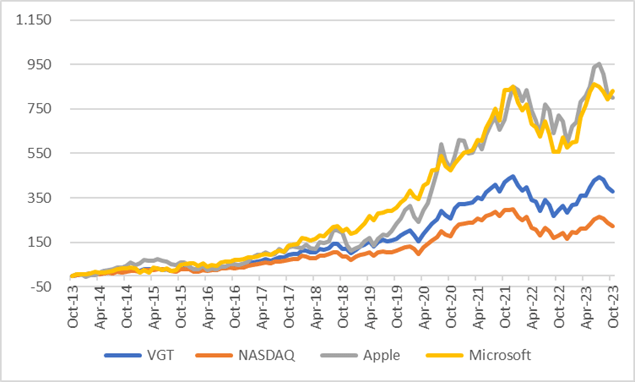
VGT vs AAPL & MSFT (Created by author with data from Capital IQ)
Concentration & Upside
I analyzed VGT using consensus estimates for 40 stocks that make up 80% of the portfolio. Using consensus price targets, I calculated that the ETF has 18% potential upside to YE24 and as can be seen Apple and Microsoft have a significant impact on the ETF. Nvidia (NVDA) at 6% is third and may drive VGT higher as it gains in weight, judging from the 58% consensus upside.
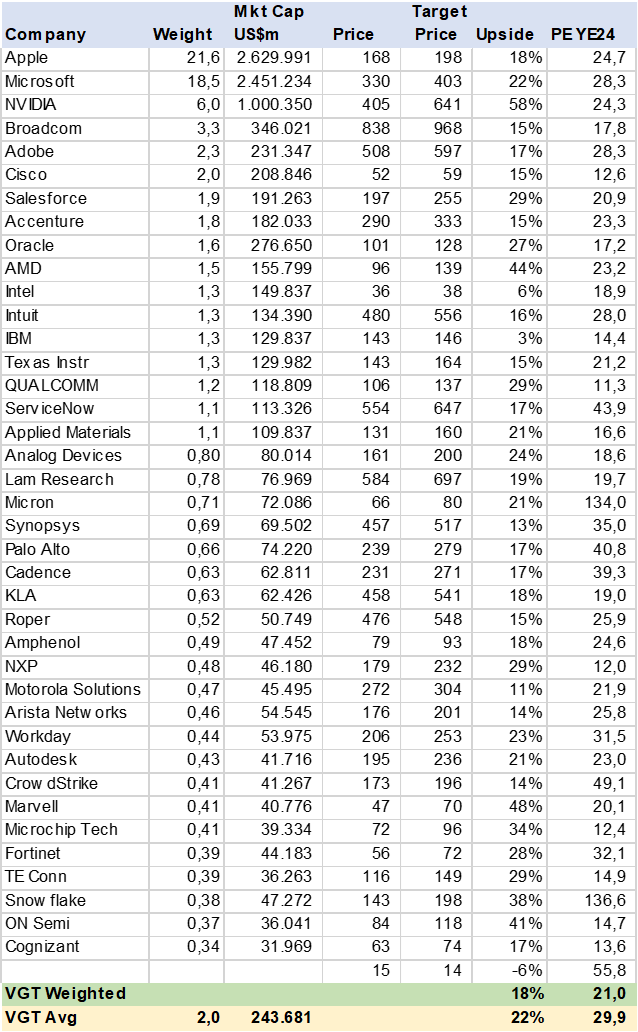
VGT Consensus Price Target (Created by author with data from Capital IQ)
Revenue Growth Challenged
One might assume or expect that a technology fund would have an aggressive revenue estimate. In this case I find VGT revenue growth, on consensus estimates, not at all exciting at 10% in the YE23-25 period. This is not due exclusively to the overweight in Apple or Microsoft since the simple average is 12%. It appears the tech holdings are in more mature companies. Standouts are NVDA, CrowdStrike (CRWD) and Snowflake (SNOW).
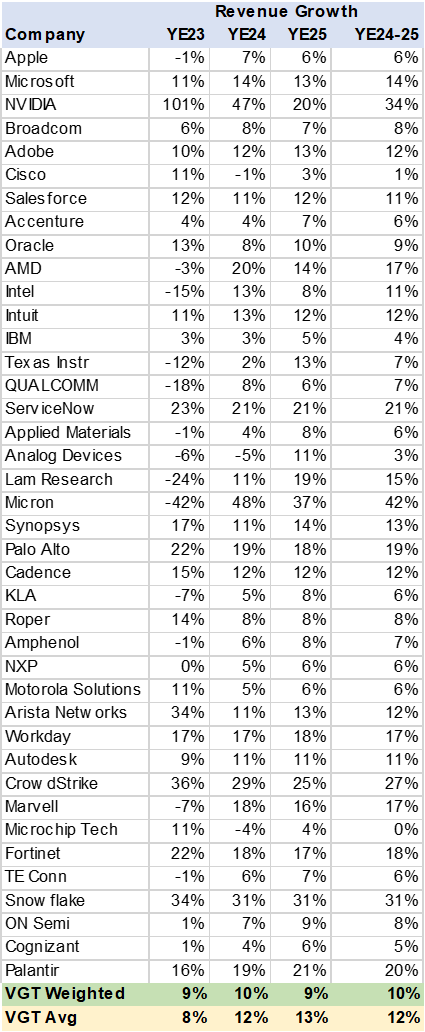
VGT Consensus Revenue Growth (Created by author with data from Capital IQ)
Impressive EPS Growth
Using consensus estimates, I calculated over 17% EPS growth for VGT in the YE24-25 period. This comes despite far lower growth rates at Apple and Microsoft. One worrying data point is that in YE24 analyst expect 11% EPS growth, a significant down shift from YE23. Can valuations support this deceleration?
Another calculation I ran was to compare YE25 EPS estimates vs YE22 actual results. I have done this exercise for three Semiconductor ETFs (SMH, XSD, SOXX) since the sector is experiencing a downturn post Covid demand spike. At VGT this is less of a concern with the portfolio registering a 50% increase vs. YE22. The bulk of the underperformers are again in semiconductor stocks.
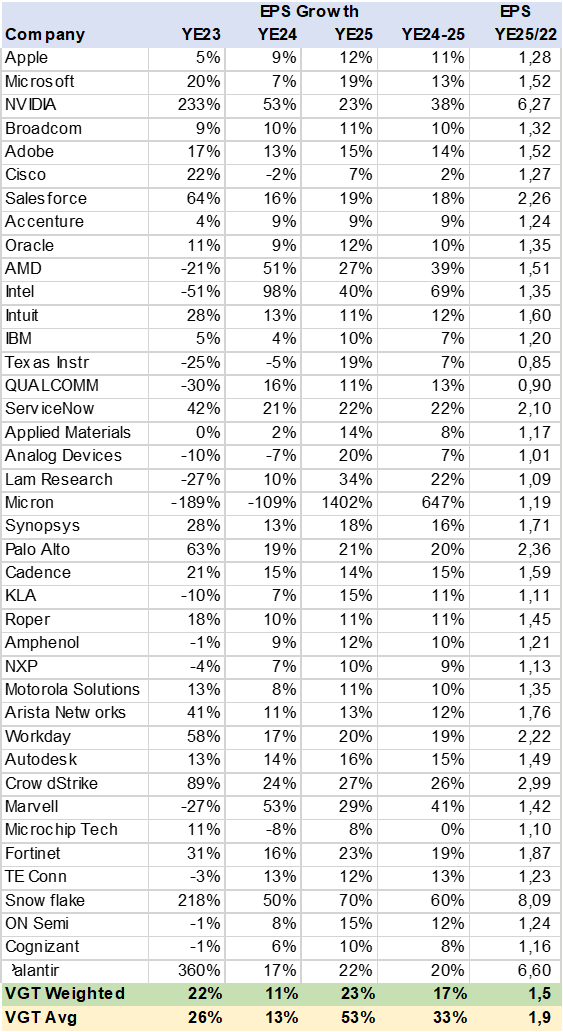
VGT Consensus EPS Growth (Created by author with data from Capital IQ)
Margin Expansion
What does look impressive is the size and growth of net margins that analysts expect in the YE23 to YE25 time frame. The weighted average increases from 22% to 26% and maybe a key driver to higher EPS growth. Margin expansion comes from a host of reasons, lower costs, scale gains, better prices, product mix, lower financial costs, or taxes.
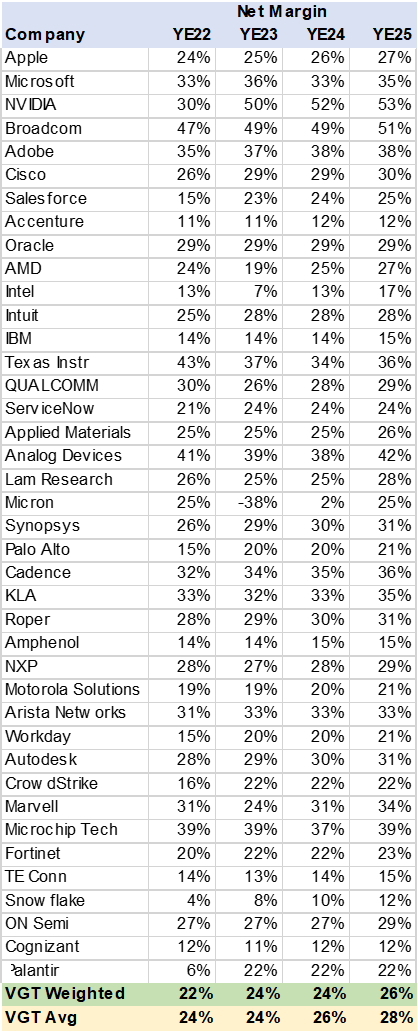
VGT Consensus Net Margin (Created by author with data from Capital IQ)
Valuation
As may be expected, valuation is a concern in the technology sector given the expensive multiples in a higher rate world. I found that measuring PE vs growth (PEG) provides a good relative perspective. As a general rule a stock may be considered cheap when the PE is less than the EPS growth rate i.e., under 1x. While far above 1x may indicate an overvalued stock.
In the case of VGT I calculated a PEG of 1.6x on YE24 PE estimates. While the market is valuing the stocks at 1.9x. This may be considered a bit expensive especially at Apple and Microsoft with over 2.2x PEG. Any downgrades may result in the ETF underperforming given the 40% weight of the two stocks.
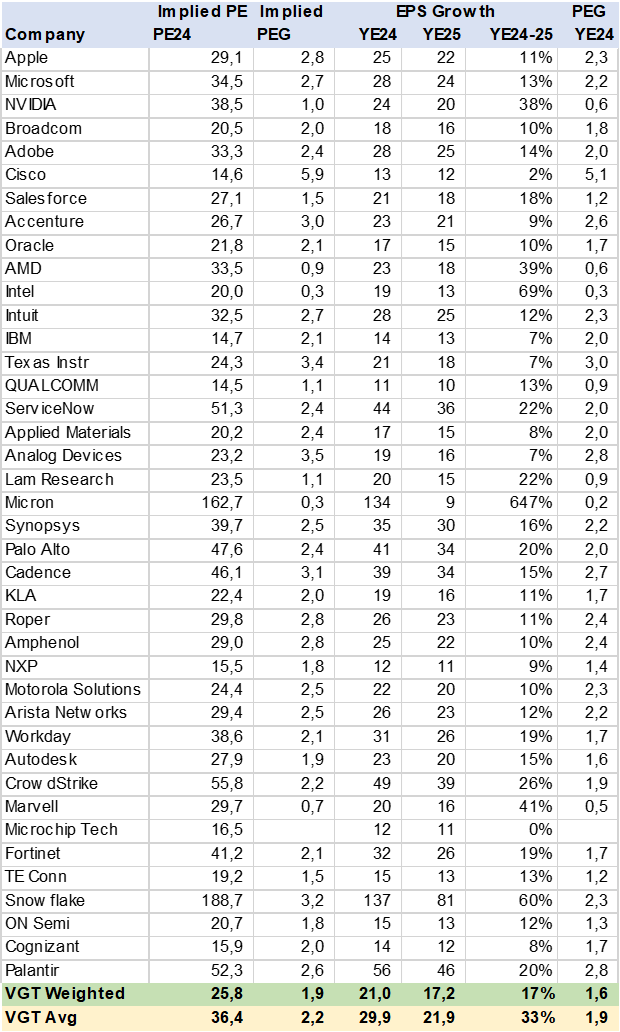
VGT Consensus Valuation (Created by author with data from Capital IQ)
Conclusion
I rate VGT a hold. An investor needs to be very positive Apple and Microsoft to own VT in my view, given the dominance the two have in the portfolio. This concentration defeats the purpose of diversification, increasing risk dynamics.
Read the full article here