


V&M Breakouts: Our 5 Top Long-Term Growth & Dividend Stocks For May 2023
Introduction
The Top Dividend Growth stock model expands on my doctoral research analysis on multiple discriminant analysis (MDA) adding new complexities with these top picks. Research shows that the highest frequency of large price breakout moves are found among small cap stocks with low trading volumes offering no dividends and delivering higher than average risk levels.
The challenge with the Top Dividend & Growth model is to deliver a combination toward optimal total return with characteristics that typically reduce the frequency and magnitude of price breakouts, but deliver more reliable growth factors for higher profitability longer term.
16 Growth & Dividend portfolios have completed 2-year returns since inception in January 2020. Final 2-year returns are shown below and the peak returns are in the yellow row.
VMBreakouts.com
January 2022 Dividend Adjusted Returns vs. S&P 500
Additionally, the January 1-year dividend adjusted portfolio returns shown below, beat the S&P 500 by +17.84% last year.
StockRover.com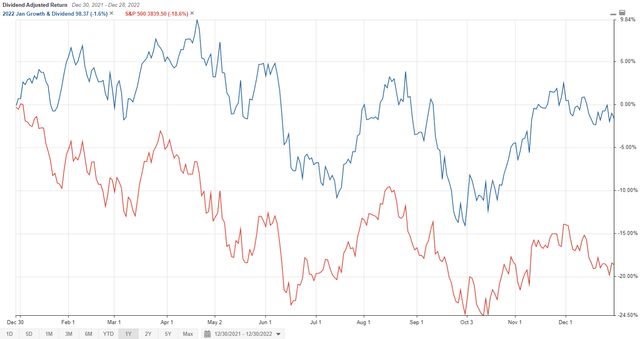
January 2023 Dividend Adjusted Returns vs. S&P 500
The current January portfolio through April is up +5.4% with dividend adjusted returns but trailing the S&P 500 so far. Novartis (NVS) is the best performing stock in the portfolio so far, up +18% YTD with 8 months to go.
StockRover.com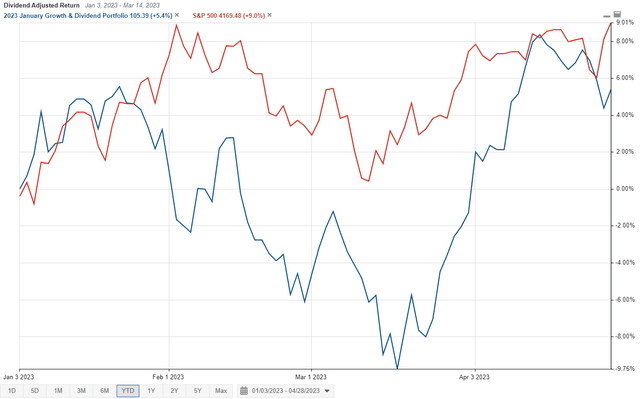
Members are free to buy/hold any stocks for the one-year measurement period of each portfolio, hold longer, or update your Growth & Dividend portfolios with newer selections. You can consider each January portfolio as the main annual selection, but you also get 11 monthly bonus selections for you to consider throughout the year to refresh your portfolio. The list of top performing MDA Growth & Dividend stocks is in the table near the end of the article.
Growth & Dividend Adjusted Portfolio Returns for 2023
The first four Growth & Dividend Portfolios of the year are plotted below if their selection had all begun at the start of the year. So far the March portfolio +8% would be the best. You can see from the strong similarities in portfolio and S&P 500 performance that moving to cash on the February and March negative Momentum Gauge signals to avoid those downturns would significantly enhance all the returns to date.
StockRover.com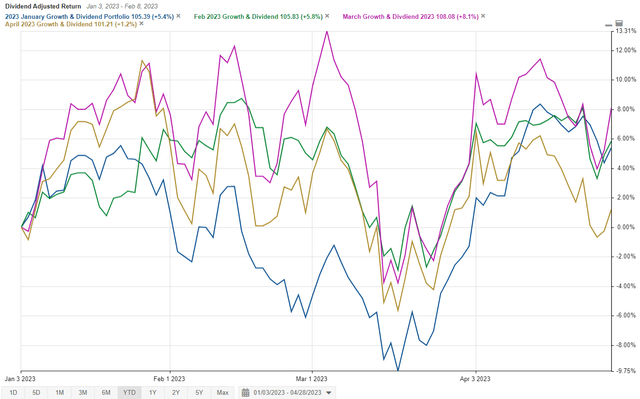
Each monthly selection portfolio consists of 5 stocks above a minimum $10 billion market cap, $2/share price, 500k average daily volume and a minimum 2% dividend yield. The population of this unique mega cap segment is approximately 330 stocks out of over 7,800 stocks across the US stock exchanges. While these stocks represent less than 5% of available stocks, their market cap exceeds $19 trillion out of the approximately $33 trillion (57.6%) of the U.S. stock exchanges. Efforts are made to optimize total returns on the key MDA price growth factors (fundamental, technical, sentiment) for the best results under these large cap constraints with high priorities for dividend growth and dividend yield.
** Starting this past March I am applying a Piotroski value filter to the MDA Growth & Dividend Stocks for to see if we can further enhance results.
Top Growth & Dividend Stocks For May 2023
- Merck & Co (MRK)
- Genuine Parts (GPC)
Sample picks from the member portfolio for May.
Score Overview of the Growth & Dividend Stocks for May
StockRover.com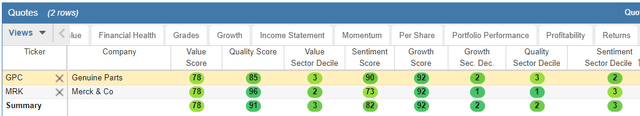
Dividend Calendar
Average Portfolio Dividend Yield 4.3%
StockRover.com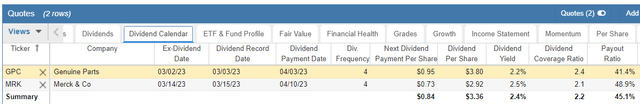
The factors shown above are not necessarily selection variables used in the MDA analysis and dividend algorithms for growth and strong total returns. Dividend yield for all these selections is well above 2% minimum for this portfolio and two stocks as high as 11.0%. These are among the highest dividend yielding mega cap stocks with strong growth and may attract strong net inflows if market conditions contribute toward more defensive positions. These additional financial perspectives and reports are included to enhance your investment decisions for total returns. The returns shown in all the annual measurements do not include any of these large dividend yields.
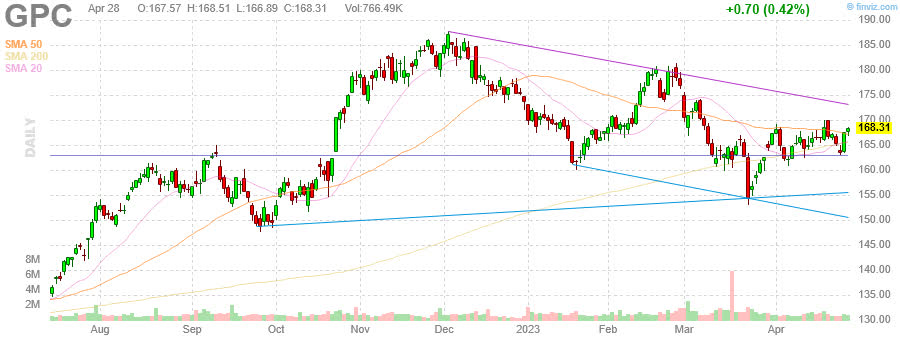
Genuine Parts
FinViz.com
StockRover.com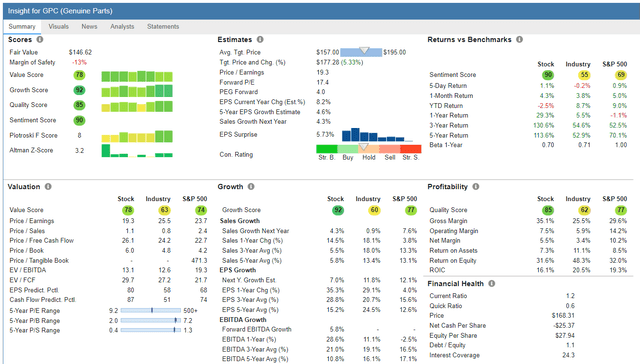
StockRover.com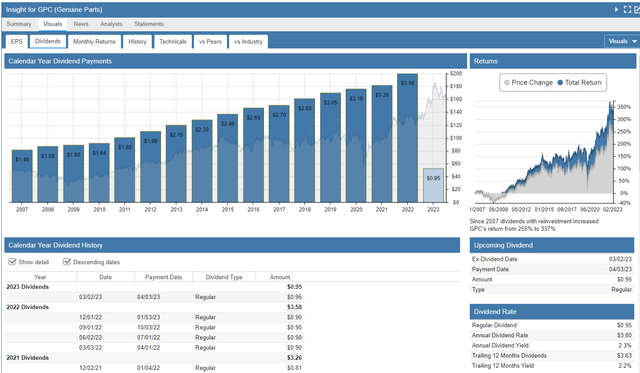
Genuine Parts Company distributes automotive replacement parts, and industrial parts and materials. It operates through Automotive Parts Group and Industrial Parts Group segments. The company distributes automotive replacement parts for hybrid and electric vehicles, trucks, SUVs, buses, motorcycles, recreational vehicles, farm vehicles, small engines, farm equipment, marine equipment, and heavy duty equipment; and accessory and supply items used by various automotive aftermarket customers, such as repair shops, service stations, fleet operators, automobile and truck dealers, leasing companies, bus and truck lines, mass merchandisers, farms, and individuals.
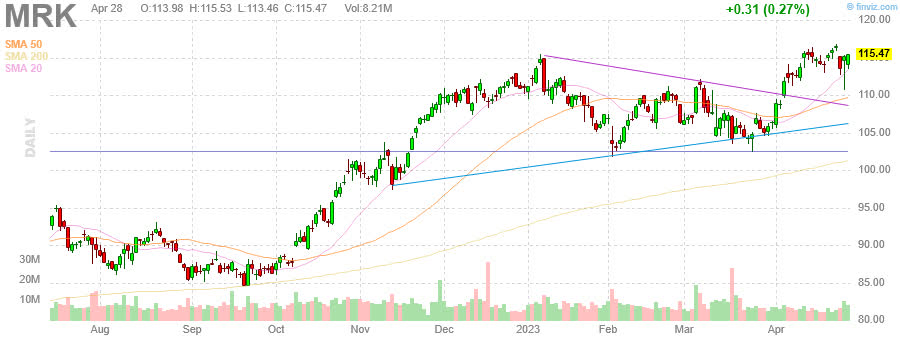
Merck & Co
FinViz.com
StockRover.com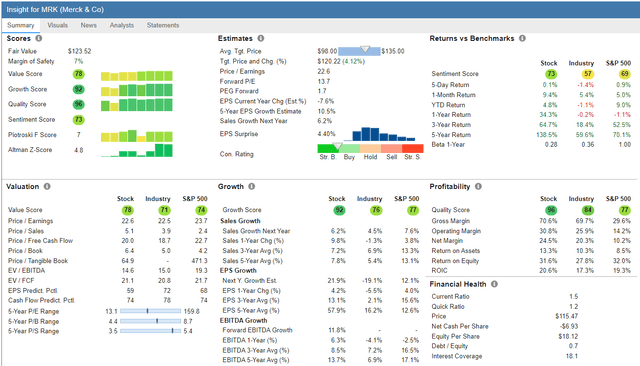
StockRover.com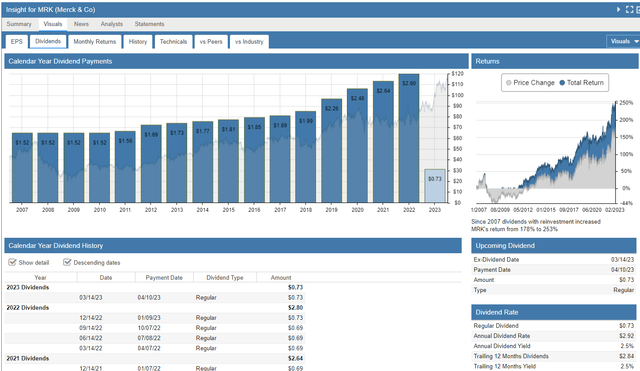
Merck & Co., Inc. operates as a healthcare company worldwide. It operates through two segments, Pharmaceutical and Animal Health. The Pharmaceutical segment offers human health pharmaceutical products in the areas of oncology, hospital acute care, immunology, neuroscience, virology, cardiovascular, and diabetes, as well as vaccine products, such as preventive pediatric, adolescent, and adult vaccines.
Prior Returns from January 2021
These selections are down significantly from their highs, but still outperforming the stock market and all the major Hedge Fund averages since inception. Returns are greatly enhanced by following the Momentum Gauge® signals and avoiding major downturns. The returns for all the portfolios since the selections began January 2020 are shown below.
Current Dividend Portfolios in 1-year Measurement for 2022
The current weighted average 1-year returns to date are 1.17% on the MDA Growth & Dividend selection model, not adjusted for greater than 2% annual dividends. S&P 500 is up +0.91% over the same period. Exclusion of the April portfolio the only month heavily based in financial stocks would significantly improve the average monthly returns.
VMBreakouts.com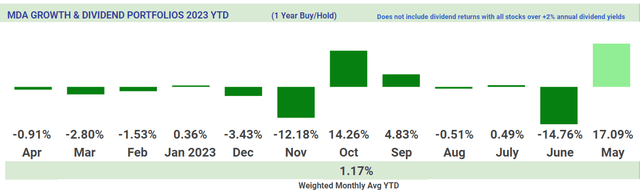
The current weighted average 2-year returns to date are -4.21% on the MDA Growth & Dividend selection model not adjusted favorably +8.2% for two years of dividends. The S&P 500 gains are -0.28% for the past 2 years.
Ongoing Dividend Portfolios in 2-year Measurement from 2021
Not adjusted for dividends
VMBreakouts.com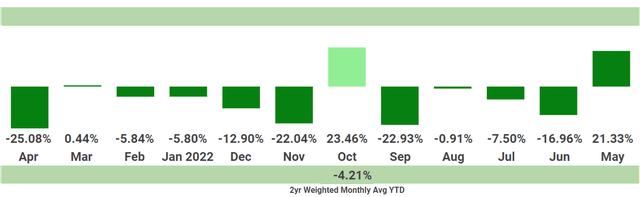
Completed Dividend Portfolios from 2020
Measured by 2-Year returns not including the large 2%+ dividends. Peak gains over the 2-year measurement period highlighted in yellow.
VMBreakouts.com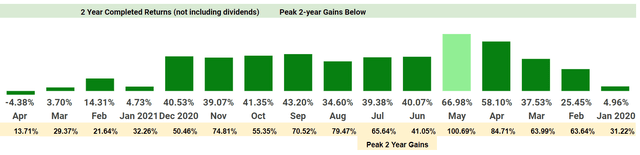
Prior Long Term Gainers to Consider
This section is a brief listing of the strong prior selections from member portfolios that are delivering on the long term growth forecast. Many of these stocks are in more than one monthly selection portfolio as high variable standard criteria often produces a small pool of strong candidates with frequent overlap.
These selections significantly outperformed major Hedge Funds through 2022 and hedge fund benchmarks since inception.
| Symbol | Company | Price | Gain from Selection |
| (LLY) | Eli Lilly And Co | 395.86 | 185.37% |
| (LLY) | Eli Lilly And Co | 395.86 | 180.75% |
| (KLAC) | KLA Corp | 386.54 | 168.92% |
| (COP) | ConocoPhillips | 102.89 | 144.39% |
| (NVO) | Novo Nordisk A/S | 167.09 | 125.95% |
| (AMP) | Ameriprise Financial, Inc. | 305.12 | 117.83% |
| (AMP) | Ameriprise Financial, Inc. | 305.12 | 103.36% |
| (AMP) | Ameriprise Financial, Inc. | 305.12 | 92.03% |
| (KR) | Kroger Co | 48.63 | 72.88% |
| (HPQ) | HP Inc | 29.71 | 70.45% |
| (INFY) | Infosys Ltd ADR | 15.54 | 68.36% |
| (UMC) | United Microelectronics Corp | 8.03 | 67.64% |
| (CNQ) | Canadian Natural Resources Ltd | 60.97 | 66.86% |
| (AMP) | Ameriprise Financial, Inc. | 305.12 | 59.96% |
| (AMP) | Ameriprise Financial, Inc. | 305.12 | 57.01% |
| (TSM) | Taiwan Semiconductor Mfg. Co. Ltd. | 84.30 | 56.58% |
| (HPQ) | HP Inc | 29.71 | 56.45% |
| (BLK) | BlackRock Inc | 671.20 | 52.56% |
| (GIS) | General Mills, Inc. | 88.63 | 52.55% |
| (UMC) | United Microelectronics Corp | 8.03 | 51.51% |
| (CNHI) | CNH Industrial N.V. | 14.10 | 48.73% |
| (BP) | BP p.l.c. | 40.28 | 47.38% |
| (NTES) | NetEase, Inc. | 89.13 | 45.59% |
| (HUBB) | Hubbell Incorporated | 269.32 | 44.14% |
| (CMI) | Cummins Inc. | 235.04 | 43.76% |
| (KR) | Kroger Co | 48.63 | 43.66% |
| (INFY) | Infosys Ltd ADR | 15.54 | 42.05% |
| (KR) | Kroger Co | 48.63 | 40.96% |
| (HIG) | Hartford Financial Services Group, Inc. | 70.99 | 40.05% |
There is overlap over the years among different monthly portfolios. The recurrence of selection is a strong indicator of long term success.
*Returns to date on the MDA Growth & Dividend selection model do not include large dividends from each stock.
Conclusion
These stocks continue a live forward-testing of the breakout selection algorithms from my doctoral research applied to large cap, strong dividend growth stocks. None of the returns listed above include the high dividend yields as part of the performance and would further increase total returns for each stock. These monthly top Growth & Dividend stocks are intended to deliver excellent long-term total return strategies leveraging key factors in the MDA breakout models used in the small cap weekly breakout selections.
These selections are being tracked on the V&M Dashboard Spreadsheet for members and enhancements will continue to optimize dividend, growth, and higher breakout frequency variables throughout the year.
You can find many other long term portfolio strategies beating the S&P 500 in our investing community.
All the very best to you!!
JD Henning, PhD, MBA, CFE, CAMS.
Editor’s Note: This article discusses one or more securities that do not trade on a major U.S. exchange. Please be aware of the risks associated with these stocks.
Read the full article here