


VSS strategy and portfolio
Vanguard FTSE All-World ex-US Small-Cap Index Fund ETF Shares (NYSEARCA:VSS) started investing operations on 04/02/2009 and tracks the FTSE Global Small Cap ex US Index. The fund has a large portfolio of 4616 holdings, a dividend yield of 2.86% and a cheap expense ratio of 0.07%. Distributions are paid three times a year in June, September, and December.
As described by FTSE Russell, the underlying index is a float-adjusted, market-capitalization weighted index representing the performance of small-cap stocks in developed and emerging markets, excluding the U.S. Constituents are screened for investability based on actual free float and liquidity. The portfolio turnover rate in the most recent fiscal year was 18%.
Per Fidelity size classification, the fund has about 55% of asset value in mid-cap companies, 41% in small and micro-caps, and 4% in large caps. About 72% of assets are in developed countries and 28% in emerging markets.
The heaviest-weighted countries are Canada (14.9% of assets) and Japan (13.7%), followed by the UK and Taiwan (on par at 8.9%). China and Taiwan weigh 13.8% in aggregate, so direct exposure to geopolitical risks related to China is moderate. The next chart lists the 19 countries with a weight of over 1%, which represent 89% of asset value.
VSS country allocation (chart: author; data: Vanguard.)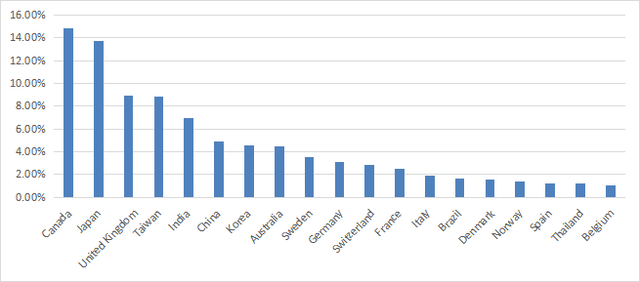
The heaviest sector is industrials (20.2%), followed by consumer discretionary (13.7%) and technology (13.1%). Other sectors are below 11%.
VSS sector breakdown (chart: author; data: Vanguard)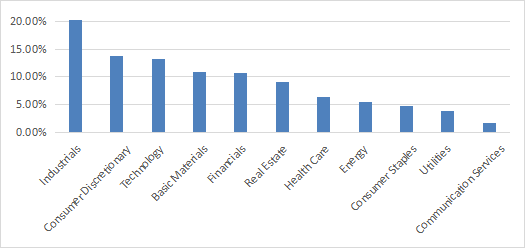
The top 10 holdings, listed below, are all in Canada and represent 3.6% of asset value. The largest position weighs 0.65%, so risks related to individual companies are very low.
|
Name |
Weight |
Country |
Ticker |
Industry |
|
Cameco Corp |
0.65% |
CA |
CCO |
Oil, Gas & Consumable Fuels |
|
WSP Global Inc |
0.53% |
CA |
WSP:CA |
Construction & Engineering |
|
RB Global Inc |
0.38% |
CA |
RBA |
Commercial Services & Supplies |
|
Open Text Corp |
0.35% |
CA |
OTEX |
Software |
|
ARC Resources Ltd |
0.32% |
CA |
ARX |
Oil, Gas & Consumable Fuels |
|
TFI International Inc |
0.32% |
CA |
TFII |
Ground Transportation |
|
Emera Inc |
0.31% |
CA |
EMA |
Electric Utilities |
|
Stantec Inc |
0.27% |
CA |
STN |
Construction & Engineering |
|
Kinross Gold Corp |
0.24% |
CA |
K |
Metals & Mining |
|
iA Financial Corp Inc |
0.23% |
CA |
IAG |
Insurance |
In summary, the portfolio is well-diversified across countries, sectors and holdings.
Valuation
The next table compares the valuation and growth metrics of VSS, an ex-U.S. developed markets benchmark (EFA), an emerging markets benchmark (EEM), and a synthetic benchmark combining developed and emerging markets with the same proportions as VSS.
|
VSS |
EFA |
EEM |
72% EFA + 28% EEM |
|
|
Price / Earnings TTM |
13.2 |
13.33 |
12.66 |
13.14 |
|
Price / Book |
1.32 |
1.67 |
1.55 |
1.64 |
|
Price / Sales |
0.85 |
1.3 |
1.31 |
1.30 |
|
Price / Cash Flow |
7.27 |
9.35 |
8.09 |
9.00 |
|
Earnings Growth |
17.85% |
14.70% |
21.18% |
16.51% |
(data source: Fidelity.)
VSS is close to the synthetic benchmark regarding the price-to-earnings ratio. However, it is significantly cheaper in price/book, price/sales and price/cash flow. It also shows a slightly higher earnings growth.
By focusing on small caps, VSS shows a better-than-average valuation in its stock universe.
Performance
Since its inception, VSS has been close behind EFA and far ahead of EEM in annualized return and risk-adjusted performance (reported as Sharpe ratio in the next table).
|
Total Return |
Annual Return |
Drawdown |
Sharpe ratio |
Volatility |
|
|
VSS |
180.14% |
7.25% |
-43.51% |
0.42 |
17.66% |
|
EFA |
190.15% |
7.51% |
-34.19% |
0.43 |
16.53% |
|
EEM |
93.72% |
4.60% |
-39.82% |
0.27 |
19.38% |
Calculations: Portfolio123.
Total returns in 2023 to date are in accordance with the current proportions of developed and emerging markets in the portfolio. VSS is at 14.37%, while the synthetic benchmark “72% EFA + 28% EEM” would be at 14.02% (without rebalancing since 1/1/2023).
VSS vs EFA, EEM, year-to-date (Seeking Alpha)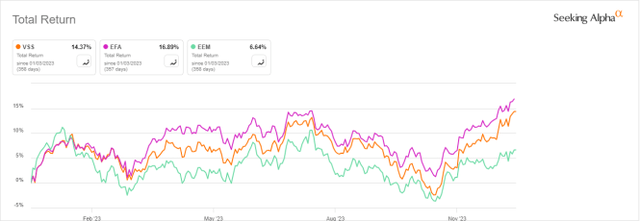
VSS vs. competitors
The next table compares the characteristics of VSS and five of the largest international small-cap ETFs:
- iShares MSCI EAFE Small-Cap ETF (SCZ)
- Schwab International Small-Cap Equity ETF (SCHC)
- Schwab Fundamental International Small Co. Index ETF (FNDC)
- iShares International SmallCap Equity Factor ETF (ISCF)
- Invesco FTSE RAFI Developed Markets ex-U.S. Small-Mid ETF (PDN).
|
VSS |
SCZ |
SCHC |
FNDC |
ISCF |
PDN |
|
|
Inception |
4/2/2009 |
12/10/2007 |
1/14/2010 |
8/15/2013 |
4/28/2015 |
9/27/2007 |
|
Expense Ratio |
0.07% |
0.40% |
0.11% |
0.39% |
0.23% |
0.49% |
|
AUM |
$10.00B |
$10.09B |
$3.97B |
$3.20B |
$544.93M |
$525.68M |
|
Avg Daily Volume |
$66.57M |
$80.92M |
$18.43M |
$6.34M |
$1.72M |
$2.20M |
|
Holdings |
4616 |
2246 |
2179 |
1742 |
994 |
1509 |
|
Top 10 |
3.62% |
3.60% |
5.45% |
2.04% |
7.05% |
2.86% |
|
4-year average yield |
2.72% |
2.76% |
2.62% |
2.44% |
3.22% |
2.64% |
VSS is second behind SCZ in assets and liquidity (dollar volume), and it has the lowest expense ratio in this group. It is second behind ISCF regarding the 5-year total return, as plotted on the next chart.
VSS vs. competitors, 5-year total return (Seeking Alpha)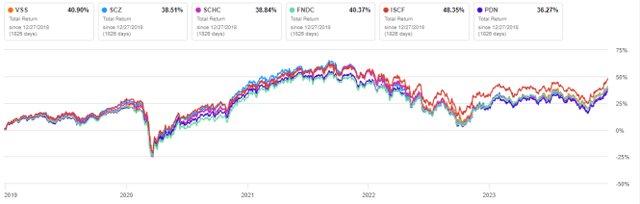
In 2023 to date, VSS is leading the pack, on par with FNDC.
VSS vs. competitors, 2023 to date (Seeking Alpha)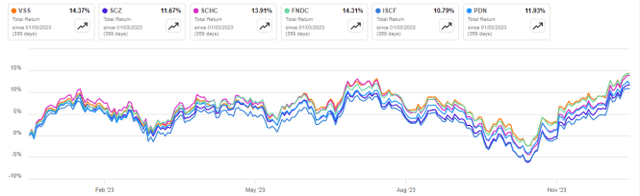
Takeaway
Vanguard FTSE All-World ex-US Small-Cap Index Fund ETF Shares is invested in over 4000 small caps listed in developed and emerging markets. It is well-diversified across countries, sectors and holdings. About 14% of assets are directly exposed to geopolitical risks related to China, which is reasonable. VSS shows a better-than-average valuation in its stock universe. It has performed well relative to competitors and has a very low expense ratio in its category, which makes it attractive for investors looking for international diversification with a tilt to small and mid-cap companies.
Read the full article here