


I never miss the monthly J.P. Morgan Guide to the Markets. One of my go-to charts is the refresh on the US vs ex-US stock market view. The MSCI All Country World Ex-US minus S&P 500 next 12-month dividend yield spread is now more than 1.8% – more than two standard deviations above the long-term average. It suggests that foreign stocks, particularly those with a solid yield, are relatively cheap.
I have a buy rating on the Vanguard International High Dividend Yield Index Fund ETF Shares (NASDAQ:VYMI) for its low valuation and solid long-term growth trends, though the chart has its concerns.
Ex-US Stocks Feature Big Dividends Compared to the S&P 500
J.P. Morgan Asset Management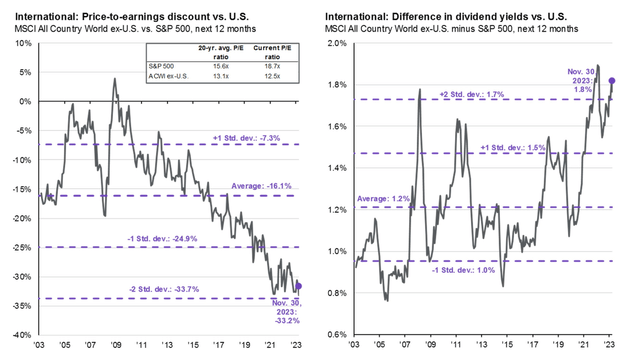
According to Vanguard, VYMI seeks to track the performance of the FTSE All-World ex US High Dividend Yield Index. The ETF provides investors with easy and low-cost access to international equities forecast to have above-average dividend yields. The fund employs a passively managed, sampling approach to portfolio allocation.
VYMI is a large ETF with more than $6.5 billion in assets under management and it pays a high 4.4% trailing 12-month dividend yield as of December 1, 2023. Share-price momentum has turned up in the last five weeks as equities have rebounded sharply, and I will point out some key indicators as we approach the end of the year.
Cost-conscious investors should appreciate the ETF’s low 0.22% annual expense ratio while VYMI’s risk ETF Grade is impressive at A- given its somewhat modest volatility readings. Finally, liquidity is strong considering the fund’s average daily trading volume of 345k shares and narrow 30-day median bid/ask spread of just three basis points.
Digging into the portfolio, VYMI features high exposure to the large-cap value space of the equity style box. The 4-star, silver-rated fund also has a significant amount of assets considered large-cap blend. With just 3% in the growth column and merely 13% of SMID-cap exposure, the ETF is somewhat concentrated, so paying attention to global cyclical growth trends is key given the multinational value weight. But take a look at the low 8.8x price-to-earnings ratio – that is less than half the multiple of the S&P 500 while VYMI’s long-term earnings growth rate is healthy at 8.6%, making for a PEG ratio near 1.
VYMI: Portfolio & Factor Profiles
Morningstar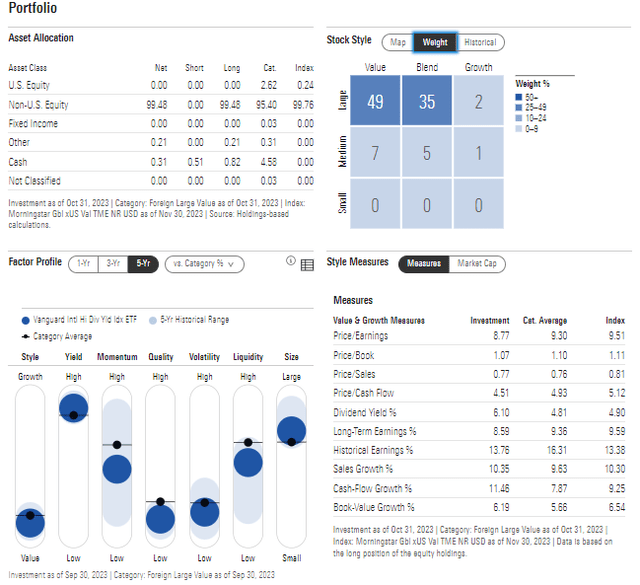
The reason for the modest valuation is a high allocation to the beaten-down Financials sector. More than a third of VYMI is made up of banks and other diversified financial services-type firms, but some of its largest holdings are actually in the Health Care and Energy sectors. There’s relatively little weight in the growth-heavy Information Technology area, so expect returns to vary significantly from the SPX. Finally, there is diversification in the sense that VYMI’s top 10 positions make up just 15% of the fund.
VYMI: Holdings & Dividend Information
Seeking Alpha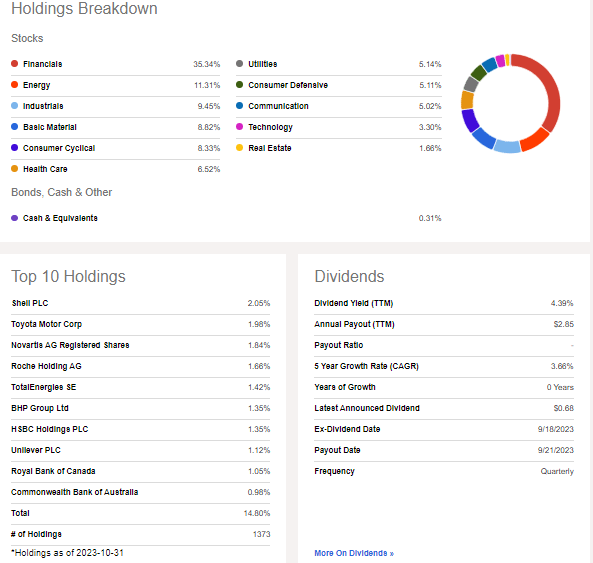
Seasonally, VYMI tends to perform well from early December through mid-January, according to data from Equity Clock, so pouncing on the opportunity to purchase sooner rather than later to establish a long-term position could prove wise.
VYMI: Bullish Seasonal Trend Through Mid-January
Equity Clock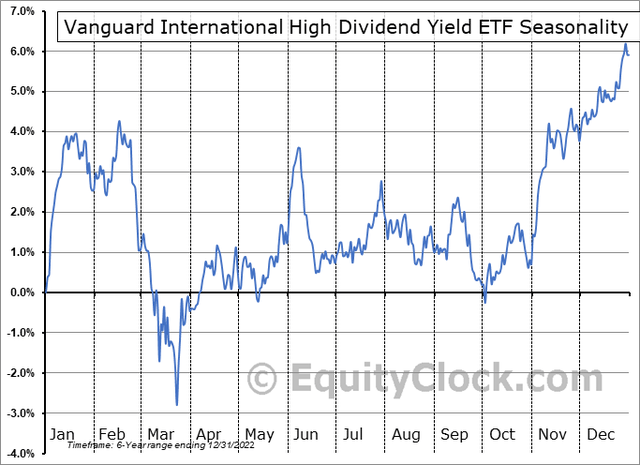
The Technical Take
VYMI’s 7-year history has been frustrating for long-time holders. Notice in the chart below that the fund remains below its January 2018 peak just above the $72 mark. Shares failed to climb above that spot on a pair of rally attempts in mid-2021 and early 2022. Following a nearly 30% plunge in 2022, the ETF has bounced back but remains sharply below the all-time high. I see reason for hope going forward, though.
Take a look at the RSI momentum oscillator at the top of the graph. The momentum reading notched a multi-month high last Friday, rallying through a downtrend resistance line. Technicians widely believe that momentum comes before price, so the RSI move could portend a bullish advance in VYMI shares. But with a flat long-term 200-day moving average, there is no trend yet. What’s more, a high amount of volume by price up to about $68 could make it tough on the bulls in the near term. I see support in the low $50s, underscoring the reality of a trading range persisting.
Overall, the technical situation is mixed.
VYMI: Neutral Technical Factors, Improved Momentum
Stockcharts.com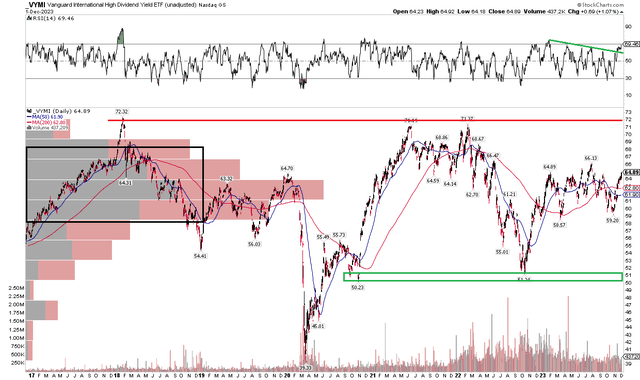
The Bottom Line
I have a buy rating on VYMI. I like its low cost, strong liquidity, and exceptionally low valuation, though the technical situation is neutral despite improved momentum.
Editor’s Note: This article discusses one or more securities that do not trade on a major U.S. exchange. Please be aware of the risks associated with these stocks.
Read the full article here