


We got the market right in 2023. In fact, we called the bottom in the Nasdaq on January 6th with the article that we wrote. As we get ready to begin a new trading year, what are we predicting for 2024?
During my 24 years as a professional money manager, it has been a very rare occurrence to see two consecutive years in the market that are alike. This past year in the market (2023) that we just finished was almost totally opposite to the previous year (2022).
Furthermore, I would be very surprised if this coming year (2024) will end up much like last year (2023). In this article, I will explain the reason why I believe this, and what an investor can do now to prepare for another unique and challenging year in the market ahead.
The one-year chart of the Nasdaq shown below is what the Nasdaq looked like one year ago.
Marketsmith.com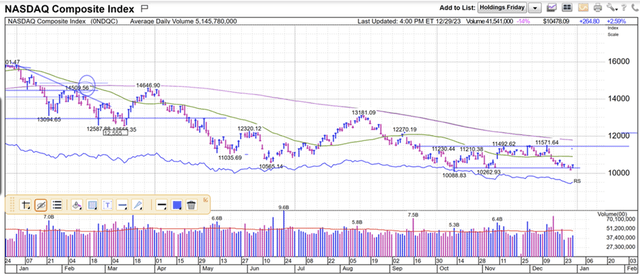
At that point in time, it was in the midst of a 33% drubbing in 2022 caused mostly by a very hawkish Fed that drove interest rates much higher. See the chart below:
Stockcharts.com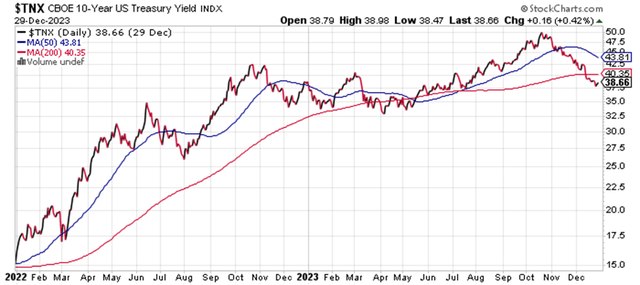
As a result of a huge rise in interest rates, multiples (P/E ratios) in the market contracted by about 33% and the higher P/E Nasdaq felt it the most.
While interest rates went higher and the multiples contracted, earnings expectations remained about the same. The sell-off in equities was not because of earnings contraction, it was because of multiple contraction.
Long-duration stocks and bonds were the worst places to be in 2022 as the rising interest rate storm was raging. But you were told by asset allocators “that a 70-year-old should have 70% of their portfolio in bonds.”
Not in a rising interest rate environment! Asset allocation should be based on more than just your age. For me, the current market climate is an even more important consideration.
The rising interest rate environment that was well signaled by the Fed in 2022 also devastated long-term bond portfolios. The longer the term of a stock or a bond, the more vulnerable it is during a rising interest rate environment.
The chart below shows the steep drop in the value of U.S. long-duration treasuries during 2022 as represented by the ETF TLT. This ETF was down a whopping 33% during that year.
Stockcharts.com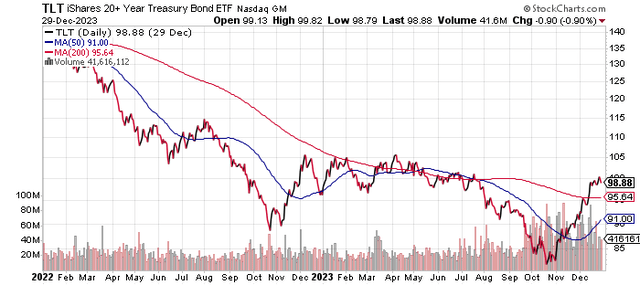
While TLT was getting slammed, the inverse version of this ETF was soaring. Keep in mind that it is also leveraged 2:1. It was up 92.4% in 2022. We used it as a hedge against our individual bond portfolio.
Stockcharts.com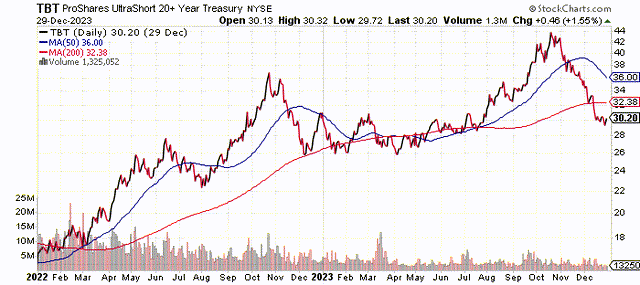
How bad was the sell-off in U.S. treasuries that year?
The late, great Silicon Valley bank folded because it had a large portfolio in its reserves of long-term U.S. treasuries. You would think a large bank like that would know better.
Apparently, they did not take into consideration the market climate that was coming. It was time to get off the long-duration tracks before one would get run over by the train being driven by Jerome Powell.
So much for the 70-30 rule for seventy-year-old retirees.
Nobody was in a worse position at the beginning of 2022 than Cathie Wood with her very long-duration portfolios. By the end of the year, her flagship fund ARKK was down a gut-wrenching 67%! That is two-thirds of your holdings wiped out.
Stockcharts.com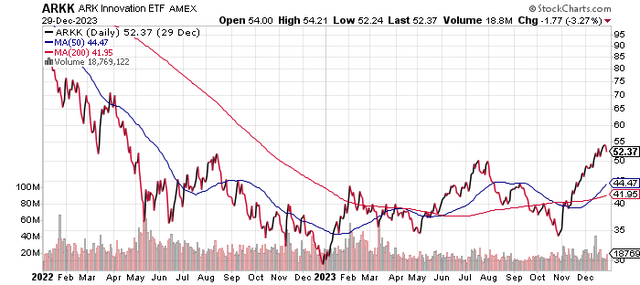
Interestingly enough, her ARKK fund was up 67% this past year (2023), but it still sports a two-year drop of 45%! That’s right. $100,000 would have become $33,000 in 2022. With a 67% gain in 2023, your balance would be back to just $55,000, well below your starting point in 2022.
But as 2022 came to a close, the market started to bottom out (review the chart at the beginning of this article of the Nasdaq from one year ago once again). You can clearly see from that chart that the Nasdaq began to build a bottom in late October-November of that year (2022).
By January 6, 2023, we were convinced that the Nasdaq had bottomed out. We even stuck our neck on the line and proclaimed it in that article that I previously mentioned.
We began going all in on big tech stocks at that time. Fortunately, that was where the best place to be in 2023. Seventeen days after we proclaimed a bottom in the Nasdaq, we wrote an article about many of the big tech stocks that were breaking out at the time.
I personally look at about 1,000 stock charts a day. I have done this almost every market day for the last 24 years. I look at those stocks that we own and those that are showing up as top-ranked stocks in my database of over 5,000 stocks that are based on Value and Momentum.
Many of the stocks that we mentioned in the article became our core position at that time and went on to become some of the biggest winners of last year.
The Nasdaq closed the year with a 43.4% gain. Most of the biggest winners of 2023 also happened to be mega-cap stocks, which I deem to be $150 billion or more in market capitalization. A representative mega-cap ETF like MGK was up almost 51% for the year.
High P/E ratio mega-caps greatly outperformed lower P/E ratio small stocks in 2023.
Most of the action in 2023 was centered in stocks like Nvidia (NVDA), Microsoft (MSFT), Advanced Micro Devices (AMD), Google (GOOG) (GOOGL), Meta Platforms (FB), Tesla (TSLA), and Amazon (AMZN). We wrote about AMD in an article that was published on May 10th of last year. AMD was up 127.6% in 2023. We still own it, but we are lightening up and putting in hedges against big tech.
Stockcharts.com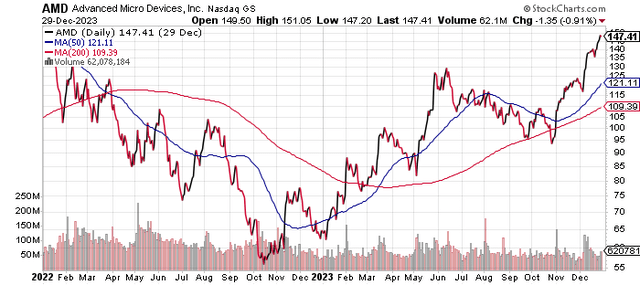
We wrote about Nvidia on August 29th of last year after owning it for most of the year. I would call Nvidia the stock of the year with its eye-popping gain of 238.9% last year. We still own the stock, but we have trimmed back on the size of our position, and we are hedging against it.
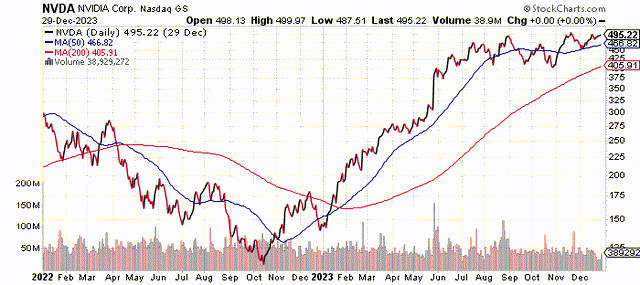 Stockcharts.com |
The market did finally begin to spread out (outside of the fabulous 7) to other neighborhoods late in the year, however. Now, as we begin 2024, this is the current one-year chart of the Nasdaq. It obviously is not in a bottoming phase like it was last year. Instead, it is closing in on its all-time high of around 16,200 and is extremely “overbought” at the current time.
Marketsmith.com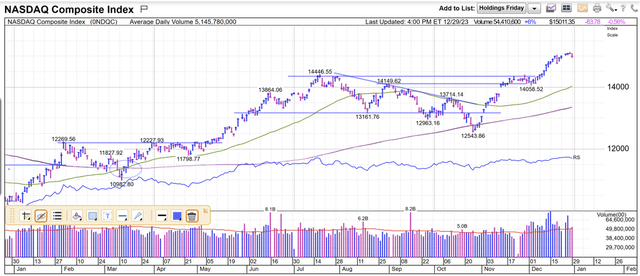
It has come a long way in 2023! It really took off in mid-October when the Fed finally signaled their long-awaited pivot of raising interest rates to looking at maybe lowering them a few times in 2024. This news caused the stock and bond indexed to blast off and finish the year with a bang!
Now, what will 2024 bring? It will not be as easy as it was in 2023. The stocks that carried the market in 2023 are unlikely to carry the weight again this year. In addition to this, the market is now way overbought and P/E ratios have become extended, especially amongst the leading stocks of last year.
Some re-balancing would be the first order of the day. Trimming back on positions that have become oversized due to their big gains in 2023 would be a prudent move. Stocks with big gains could be vulnerable to profit-taking that was delayed until this new year to put off capital gains taxes. January could be very interesting and challenging.
A contrarian approach to the market may also be in order this year. We have not had a contrarian market in many years. With mega-cap high P/E stocks dominating the market in 2023, it would not surprise me to see smaller and lower P/E stocks do well this coming year.
Notice the recent technical breakout of this small-cap value ETF. This is about as contrarian as one can get after a year that was led by Mega-Cap growth stocks.
Marketsmith.com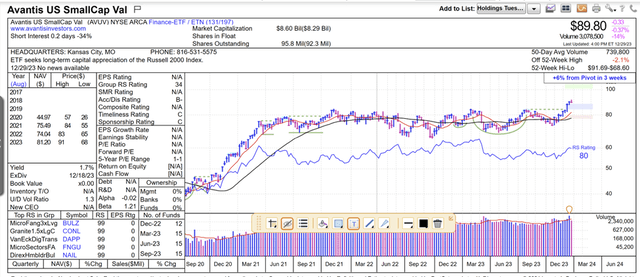
This could finally be a year where value (low P/E) trumps growth (high P/E). We have not seen this in a long time, either. But as always, selection will be critical. There are a lot of really bad value stocks, and there are numerous very bad small-cap stocks. Low P/E ratios are one thing, quality and growth is another.
Earnings will also be very critical in 2024. See the chart below for the current expectations.
GundersonCapital.com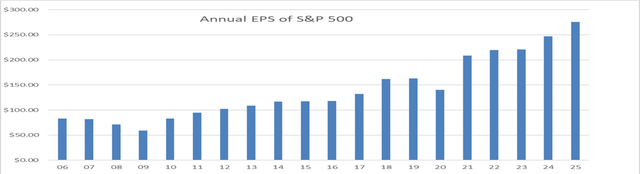
These estimates are obviously subject to change on a weekly basis. As of now, the market is expecting record earnings this coming year and the year after that. The current forward P/E ratio for the S&P 500 is now up 20.8X, however. This is too rich for this current environment interest rate environment that we are in.
A forward P/E ratio more in the 17-19X range would be more appropriate. Is there any better explanation for the bull market that has occurred from 2009 to the present than rising earnings? I don’t think so.
The consensus 12-month price target for the S&P 500 is around 5,100. With the S&P 500 currently almost at 4,800 that does not make for a lot of upside potential going forward. A good correction would make that number a lot more attractive, however.
In summary:
2023 was a great year in the market if you were in the Mega-Cap tech stocks. This is where we were mostly parked throughout the year.
2024 looks to be much different than last year.
Look for more of a contrarian approach this coming year.
Beware of expensive mega-caps early in the year. We should see some heavy profit-taking and rebalancing into less expensive and smaller stocks.
Take your vitamins, stay tuned to our articles, and strap on your seat belt as 2024 could be very interesting.
Read the full article here