


The Q4 rally entered the last two weeks of the year and what is taking place in the equity market shouldn’t be a total shock. We’ve talked about the catalysts for the price action we are witnessing now since October. Investment managers that were left behind because they weren’t heavily weighted in the Magnificent 7 (the majority), have no choice– they have to chase. There is a huge incentive to show their clients they are in the right stocks going into the end of the year. They also have to show numbers to warrant their annual bonuses. This last-minute chase to generate profits has now graduated to the next level, and it’s because many investment firms were caught offside for most of this year.
“Animal spirits” is a term coined by the famous British economist, John Maynard Keynes, to describe how people arrive at financial decisions, including buying and selling securities, during economic stress or uncertainty. In Keynes’s 1936 publication, “The General Theory of Employment, Interest, and Money” he speaks of animal spirits as the human emotions that affect consumer confidence.
Today, animal spirits describe the psychological and emotional factors that drive investors to take action when faced with high levels of volatility in the capital markets. The term comes from the Latin spiritus animalis, which means “the breath that awakens the human mind.” In some ways, Keynes’ insights into human behavior predicted the rise of behavioral economics.
That is the “official” explanation of what we are experiencing in the equity markets today. I prefer to offer a simple explanation, one that I have referred to many times.
“In the short term, EMOTION trumps everything else.
As I said yesterday. it matters little what an individual investor “thinks”. It’s the masses that make up the market that determine price action, and it is that same price action that MUST be followed. It is a fool’s errand to go against the “masses”. An investor either sits and watches. or runs the risk of the word “trampled” entering the discussion.
Of course, the tricky part is making the decision when enough is enough and it’s time to get off the train. It is a decision that will ALWAYS haunt EVERY investor. The first part of being a successful investor is getting on the train in the first place. Amazingly most investors fail to get on board because the human mind can find every excuse to point out why it is right and the masses are wrong.
By the time they finally decide to jump on it is often too late and they too find themselves stuck not knowing when to get off. There is one distinct difference between those two scenes. Those who joined the ride early can move on with profits, while many of the “Johnny Come lately” crowd leave the train with losses. Notice I said “can” move on, instead of “did” move on, and that takes us back to the original problem of when to leave.
There is no black-and-white answer, except that if one lets another EMOTION enter the scene they will join the “Johnny Come Lately” crowd. GREED is a great equalizer, a magician of sorts. It can take profits and turn them into losses right before your eyes. Avoiding emotion isn’t easy, especially when money is involved. So if you find yourself making mistakes, join the army that came before you. Mistakes are UNAVOIDABLE.
It is NOT easy, but the successful learn to LIMIT their mistakes. There is yet another lesson to be learned from this year-end rally. Relying strictly on the fundamental scene and dismissing the use of the market’s “technical setup” is one of the BIGGEST mistakes an investor can ever make. That’s not MY opinion, the stock market told us that during this Q4 rally.
Week On Wall Street
The S&P entered trading Monday on a seven-week winning streak. The index remained in party mode adding another 21 points to a new recovery high at 4740, as it seeks to extend that streak to eight weeks. The S&P and NASDAQ were the strongest indices, and the DJIA extended its streak of new highs to 4 days with a gain of 1 point. The Russell was flat.
Tuesday’s trading began with the S&P 500 on an 8-day winning streak and just 1.2% from its all-time high. All of the indices moved higher with the DJIA rallying to its 5th straight day with a record close.
The S&P started Wednesday on a 9-day winning streak and just 0.70% from its all-time high. The daily winning streaks for the indices were all broken as every major index was down more than 1% with the Russell staging a major reversal and losing 1.8% on the day. The 37-day BUYING stampede for the S&P ended with the index falling 70 points (-1.5%) to close at 4698.
After Wednesday’s 1.5% drop in the S&P, the dip buyers showed up early and moved the indices higher, and for the most part, held the early gains. The S&P clawed back 1% of that loss closing at 4746. The BULLS took all of the indices and every sector higher on the day. The Russell 2000 was The big loser on Wednesday, but turned it around, and led all of the major indices higher rallying 1.7%.
The Holiday mood continued with a light trading day on Friday. A day where the S&P and NASDAQ Composite posted a modest gain while the DJIA endured a modest loss. The small caps (IWM) added another 0.84% extending its winning streak to six. The S&P, DJIA, and the NASDAQ Composite have now posted eight straight weeks of gains.
Global Market Scene
Besides the US, the rally over the last several weeks has been global. Of the ETFs that track the G7 countries around the world, all seven were up in the latest week, and they all started the week at overbought levels.
G7 (www.bespokepremium.com)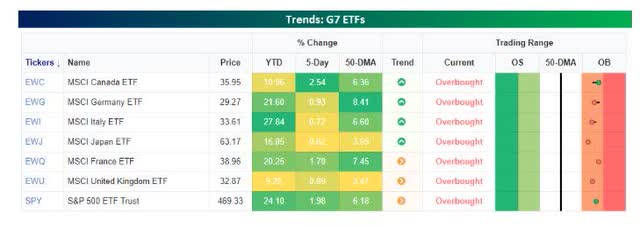
With its gain of nearly 2%, the S&P 500 tracking ETF (SPY) was the second-best performer last week trailing only the 2.54% gain in the Canadian ETF (EWC). On a YTD basis, the US is one of four ETFs with a gain of over 20% YTD, and only Italy’s 27.8% topped the S&P 500.
Markets can stay in an overbought or oversold condition for a while.
Remember, “Overbought” is a condition, not necessarily a trigger to act. Only Price action is a trigger.
Looking at the charts of all seven ETFs representing the G7, they’re all right at or near 52-week highs.
G7 charts (www.bespokepremium.com)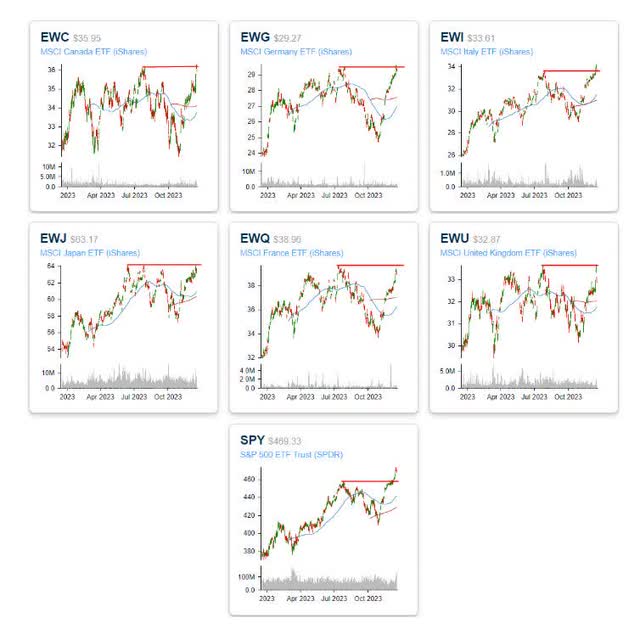
One key difference between the US and the rest of the world, though, is that while other countries are still testing or only marginally higher than their summer highs, the US handily took that level out over a week ago as it has been a leader.
The Global technical picture could either be telling us we are on the cusp of a Global stock market breakout or the indices are ready to pull back into a trading range. Here is one “technical” issue that might be sending a signal as to what happens next. While stocks have been rallying on a global basis, overall breadth is lagging. While the MSCI World Index has taken out its summer highs and broken the downtrend from the 2021 peak, the cumulative A/D line of individual country indices has yet to make a higher high. Unless rectified quickly, breadth divergences usually lead to strong pullbacks.
The Economy
U.S. personal income increased 0.4% in November and spending rose 0.2%. October income had edged up 0.3% and spending was up 0.1% in October. The PCE deflator declined -0.1%, lower than expected, after an unchanged print previously. It slowed to a 2.6% y/y clip from 2.9% y/y. The core rate also inched up 0.1% on the month from 0.1% previously. And it decelerated to 3.2% y/y, the weakest since spring 2021, from 3.4%.
Atlanta Fed’s GDPNow growth forecast is slightly firmer at 2.7% for Q4, up from the 2.6% rate from last Friday. The uptick was a function of an increase in the nowcast for Q4 real gross private domestic investment growth increased by 0.8% versus 0.5% previously. Solid growth expectations are helping underpin Wall Street’s gains but contradict the rate-cut forecasts.
The U.S. leading index fell 0.5% to 103.0 in November after dropping 1.0% to 103.5 (was 103.9) in October. The index has been in decline since April 2022. And it has not posted an increase since February 2022.
LEI (www.conference-board.org/us/)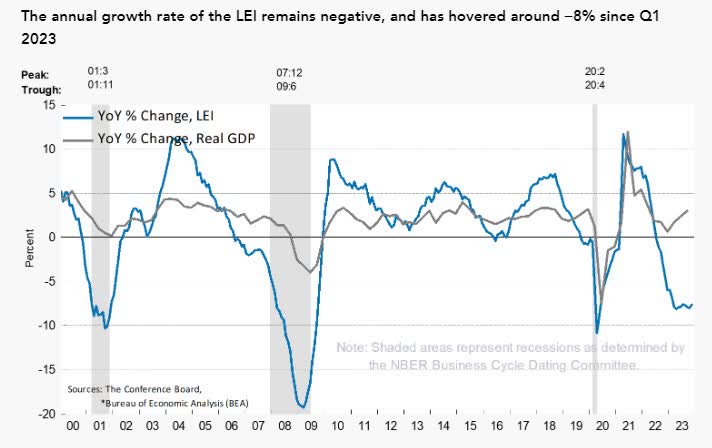
We have now seen 20 straight months of negative prints. Six of the 10 components declined, led by consumer expectations and ISM’s new orders.
The LEI is at lows that signify recession, yet the US economy is not in recession, and now the consensus reveals that there won’t be one in ’24. I continue to note the “confusing” situation that has been part of the “data” scene for the last 18 months.
Q3 GDP growth was unexpectedly revised downward on a bigger-than-expected downward bump in service consumption and revisions for equipment spending and intellectual property rights. Most analysts now see Q4 GDP growth around 1.5%.
Downward revisions of economic data seem to be the norm these days.
Manufacturing
The Philly Fed index fell to a 3-month low of -10.5 in December from -5.9, in the prior month. The components were weaker than the headline, led by big drops in orders and deliveries, and the ISM-adjusted Philly Fed fell to an 8-month low of 43.9 from a 4-month low of 46.6 in the prior report. The index has been positive for only one month this year.
Today’s Philly Fed decline accompanies a big Empire State drop to leave only a slight up-tilt in the full set of headline and component sentiment readings since a March trough, following a steady descent into Q1 of 2023 from robust peaks in November of 2021.
Philly Fed (www.tradingeconomics.com)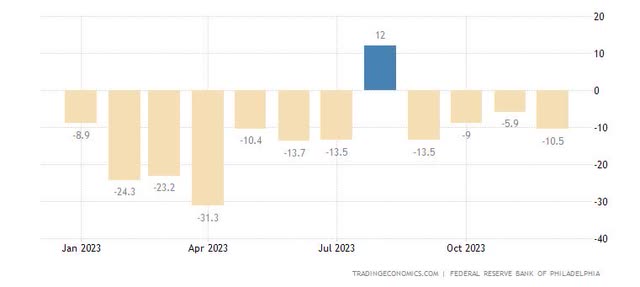
Despite the commentary about onshoring and a US manufacturing renaissance, the sector remains mired in recession.
Housing
After peaking near 8% in late October, mortgage rates have moved lower in tandem with Treasury yields. The sharp drop could help the housing market rebound in the coming months. If that occurs it does help stabilize the entire economy even further as the housing market has far-reaching effects on many other sectors other than the Real Estate market.
NAHB home builder confidence index bounced 3 points to 37 in December. It follows the 6-point drop to 34 in November and is the first increase since July. And it is off from the high of 56 from July 2022. The single-family gauge was unchanged at 40 following the 6-tick decline to that level in November. The future sales index climbed 6 points to 46 after the prior 5-tick decline to 39 previously. The index of prospective buyer traffic was up 3 ticks to 24 after sliding 5 points to 21 last month. The report noted that the drop in mortgage rates helped support the pick-up in confidence.
Housing starts surged a hefty 14.8% to 1.56 million in November, much stronger than forecast. The jump follows the 0.2% October increase to 1.35 million. This is the second-best reading of the year and the highest since May. Single-family sales popped a huge 18.0% to 1.14 million after edging up 0.3% to 0.969 million. Building permits dropped 2.5% to 1.46 million following the 1.8% pop to 1.49 million in the prior month.
Existing home sales bounced 0.8% to 3.82 million in November, better than forecast, after slumping 4.1% to 3.79 million in October. The index had been in decline since June. The month’s supply slipped to 3.5 after rising to 3.6 previously. The median sales price fell to $387,600 from $391,600.
Consumer
Consumer confidence surged 9.7 points to a hefty 110.7 in December, much stronger than expected, after edging up 1.9 ticks to 101.0 in November. This is the highest since July. Improvement was widespread across all components.
Global Economy
Since last week, Houthi rebels in Yemen have been firing ballistic missiles at ships transiting the Red Sea to access the Suez Canal. While attacks have had a low success rate, multiple ships have been struck. Accordingly, a range of companies from container carriers to ship crew providers have said they are either avoiding or minimizing the use of the route. The Red Sea carries roughly 40% of global container traffic.
That is also important because the Red Sea has become the largest single trade route for LNG since Russian flows to Europe ended with the war in Ukraine. LNG from Australia will see its transit time increase by roughly 20% if avoiding the Red Sea, while southern European ports could see a ~doubling of the time for containers to reach them. The busiest northern European ports will see containers take 40% longer to reach them. While it’s not clear how long the Red Sea will remain insecure, this dynamic is both a positive catalyst for shipping names and a new supply chain disruption
The news bolstered both the Nat gas and Liquefied Nat gas stocks. Of course, the question that begs an answer – Why are the US and the other nations that are threatened by these attacks and disruptions allowing a terrorist organization to control the global trade narrative?
Germany
IFO: Eurozone cyclical data continues to look weak. This morning all three major components of German IFO data missed estimates, and the current assessment series fell to the lowest levels since the COVID shock.
IFO (www.bespokepremoum.com)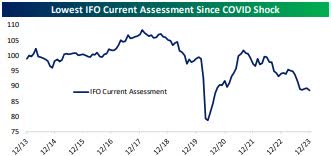
Other than that period, only the Global Financial Crisis has had worse readings since 2005. This data confirms that the backdrop just doesn’t look good in Germany.
The Daily Chart Of The S&P 500 (SPY)
As anticipated, the S&P 500 is hesitating as it approaches the old highs around 4800
S&P 500 (www.tc2000.com)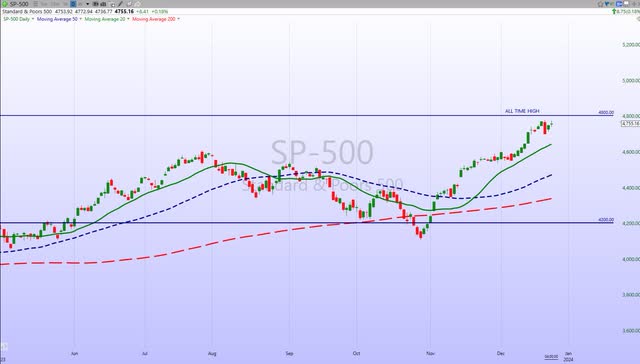
Momentum remains relentless as the “pain” trade continues to the upside.
Final Thoughts
The straight-up move since the October low has been amazing. There have been similar V-shaped rallies in the past several years but nothing like this with the same trajectory and lack of downside. The latest surge has been attributed to the last Fed meeting. With their policy announcement, the Fed just confirmed the narrative that the market had already created – that rate hikes are done and rate cuts are likely sometime next year. Usually, when an event is signaled such as this, the market will buy the rumor but then sell the news. In this case, however, the market bought the rumor and then turned right around and bought the news. To repeat, we are dealing with one of those exceptional periods in which it is all sentiment-related price action.
The sharp about-face from the Fed has been discussed ad nauseam over the past week. Just around six weeks ago, Jerome Powell told reporters that the Fed wasn’t even thinking about cuts. So what caused this clear quick shift in policy? There is no reason to get into the conspiracy theories that are floating around and that includes any politics that may or may not be involved. If the Fed is truly considering rate cuts in ’24, then one theory I can BUY into is the realization regarding how long the government can continue to service 5%+ rates with the debt load already so large and growing each year. That is a GENUINE problem that isn’t going away.
Neither valuations nor resistance have mattered since the October low and until that changes it’s hard to provide any rational analysis for what the indices may do in the near term. Based on historically-based probabilities, we should see stocks pull back from these extreme levels but that has not been the case for much of the past few weeks. This “overboughtness” has produced almost nothing on the downside, at least not in the S&P 500, until a one-day 1.5% loss on Wednesday.
The “markets can do anything” and this is a perfect example of that. So, there is nothing to say that the market cannot continue to remain “irrational” indefinitely. That implies either a continuation of this rally or the elusive pullback that is way overdue.
Given the latest Fed commentary, the market believes the economy is returning to a more normal environment. The notion that the hiking cycle is over and rate cuts will be on the way suggests a different take on the economic data and the subsequent market reaction to it. Instead of GOOD news being taken as bad because the Fed needed to raise rates, GOOD news is now GOOD news. Well, at least that is what analysts believe will occur now.
However, if good news is good news and the economy will remain strong, How does the Fed cut rates? So the market is rallying over potential rate cuts, but if history is correct, the market weakens, sometimes severely, AFTER the first cut. Confused? You should be, the current backdrop is illogical. Equities are dancing to interest rates, and emotion is ruling the price action. At the end of the day, it doesn’t matter what you or I think, it’s what the market thinks is going to occur.
Memo to Fundamentalists- Watch the price action FIRST, before you set your strategy in stone.
THANKS to all of the readers that contribute to this forum to make these articles a better experience for everyone.
These FREE articles help support the SA platform. They provide information that speaks to Both the MACRO and the short-term situation. With a diverse audience, there is no way for any author to get specific unless they’re simply highlighting ONE stock, ETF, etc. Therefore, detailed analysis, advice, and recommendations are reserved for members of my service offering on the platform.
The information provided here is verified by SA and in most cases, links are provided as supporting documentation. If anyone can point out a comment in any article I put forth and demonstrate that it is factually INCORRECT – I will REMOVE it. –
Best of Luck to Everyone!
HAPPY HOLIDAYS to ALL!!
Read the full article here