


While domestic and global oil prices have hovered in the mid-$70s to mid-$80s lately, and as oil volatility, as measured by the CBOE Crude Oil Volatility Index (OVX) now sits at multi-year lows, shares of US oil and gas companies have dropped to the worst marks relative to the S&P 500 going back to April 2022. It comes as the Information Technology sector now commands a more than 30% weight in the SPX. Everything outside of TMT, it seems, has been left in the dust during this recent surge in AI euphoria.
But the Energy sector also sports a very high total shareholder yield – the combination of the dividend yield and buyback yield. As of the end of May, that rate stood at 7.6%, the highest of any S&P 500 sector.
I have a buy rating on The Energy Select Sector SPDR® Fund ETF (NYSEARCA:XLE). While relative strength is weak and there is risk from an absolute technical perspective, its valuation is very attractive, making it a worthwhile long-term investment. The fund can also be seen as an inflation hedge at a time when bonds provide little relief when inflation fears perk up.
XLE Relative Strength Drops to the Lowest Level Since Q2 2022
StockCharts.com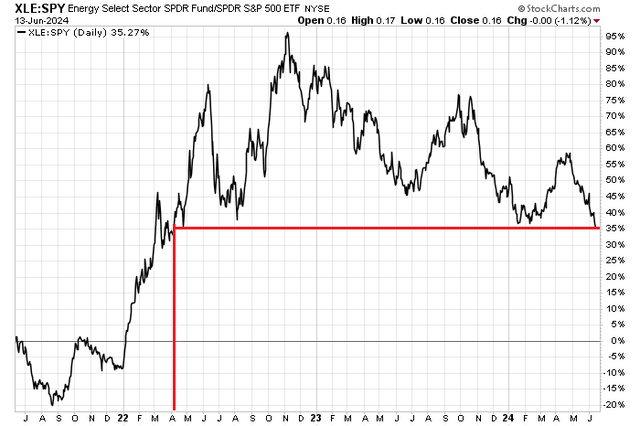
WTI Volatility – Lowest Since 2018
TradingView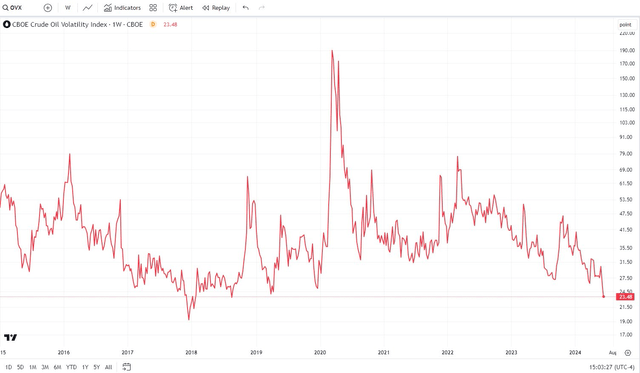
S&P 500 Sectors: Energy With the Highest Shareholder Yield
JPM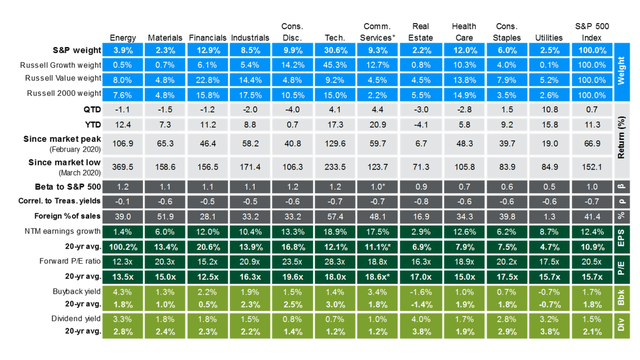
According to the issuer, XLE seeks to provide investment results that, before expenses, correspond generally to the price and yield performance of the Energy Select Sector Index. The Index seeks to provide an effective representation of the energy sector of the S&P 500 Index. The ETF seeks to provide precise exposure to companies in the oil, gas, and consumable fuel, energy equipment, and services industries and allows investors to take strategic or tactical positions at a more targeted level than traditional style-based investing.
XLE is a large ETF with more than $36 billion in assets under management as of June 13, 2024. Its annual expense ratio is very low at just 0.09% while the fund’s trailing 12-month dividend yield is close to two percentage points above that of the S&P 500 at 3.3%. While Seeking Alpha’s share-price momentum grade is solid at a B+, I will note potential technical weakness heading into the summer later in the article.
XLE is also a risky portfolio in the sense that it can quickly turn volatile and the top two positions account for a bulk of the fund’s allocation. But liquidity metrics are healthy – average daily trading volume is close to 15 million shares while its 30-day median bid/ask spread is just a single basis point, according to SSGA Funds.
Digging into the portfolio, the 4-star, Bronze-rated ETF by Morningstar plots in the upper-left corner of the style box, indicating its bent to large-cap value. There’s a material 28% weight in mid-caps, but there isn’t any small-cap exposure and hardly any growth access. Trading just 12.8 times earnings and with a long-term EPS growth rate of 7.9%, the PEG ratio is attractive, near 1.6, and XLE trades at just 1.22 times sales – also cheap.
XLE: Portfolio & Factor Profiles
Morningstar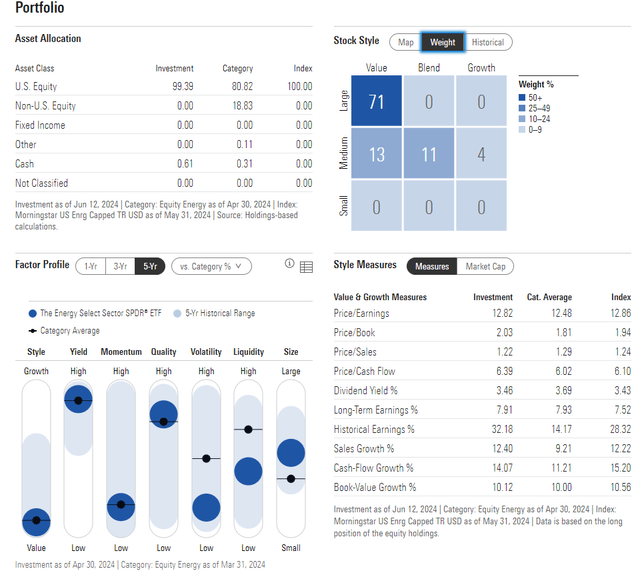
What makes XLE ripe for either big returns or protracted periods of underperformance is the reality that two companies – Exxon Mobil Corporation (XOM) and Chevron Corporation (CVX) – command a high 43% of the total portfolio. Toss in ConocoPhillips (COP), and those three stocks are more than half the allocation.
Investors can consider an equal-weight approach, but that introduces the risk of holding often less-stable oil and gas firms. Paying close attention to the fundamentals and technicals of that trio of companies can help investors manage risk when owning XLE.
XLE: Holdings & Dividend Information
Seeking Alpha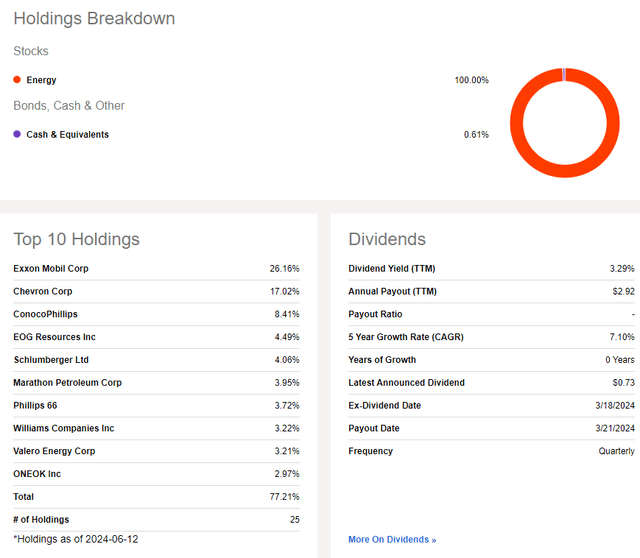
Seasonally, XLE tends to struggle in the summer months. The upside here is that the Energy sector fund often bucks the broader market’s trend of struggling in September – so that’s a diversification benefit. But with the best of the year now in the rearview mirror, calendar trends are not all that encouraging.
XLE: Weak Seasonal Trends Ahead
Seeking Alpha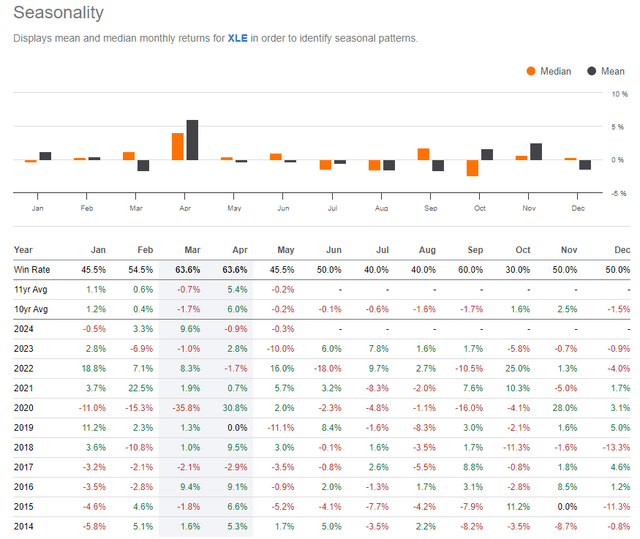
The Technical Take
With a low valuation, concentrated portfolio, and as oil volatility hovers near multi-year lows, XLE’s technical chart is unimpressive. Notice in the graph below that shares broke out to decade-highs in April, but then fell back under the critical support/resistance area between $93 and $95. It has the hallmarks of a bearish false breakout. And, as technicians are wont to say, “From false moves come fast moves (in the opposite direction.” Jump ahead to today, and XLE tests its flat long-term 200-day moving average.
Also, take a look at the uptrend support line that comes into play around $83. That could provide support, but I also see the $75 to $79 range as being key – that’s also where the base of a high amount of volume by price is apparent. Meanwhile, XLE continues to work off overbought conditions, evidenced by the extremely high RSI reading from the turn of the quarter. As it stands, XLE has retraced about half of the January through April rally, and with the 50dma turning lower, that’s not a positive sign heading into the second half of 2024.
Overall, XLE has underperformed the broader market, and its technical chart suggests a bit more downside is possible.
XLE: Bearish False Breakout Risk, Support in the Mid-High $70s
StockCharts.com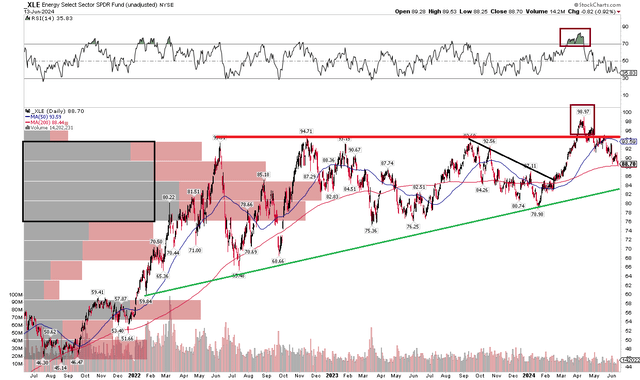
The Bottom Line
I have a buy rating on XLE. Though the technicals warrant skepticism if you are an oil & gas bull, the fund’s valuation and total shareholder yield are strong attributes.
Read the full article here