


Investment Thesis
iShares Exponential Technologies ETF (NASDAQ:XT) is a hold due to multiple risk factors that likely outweigh its returns. While the fund seeks to capture leading tech companies with high growth potential, these same holdings represent increased risk due to their lack of strong fundamentals and diversified revenue streams. In contrast, peer tech funds that capture the broader information technology sector will likely outperform XT. Finally, XT includes several foreign tech holdings in emerging markets that represent geopolitical risks as well.
Fund Overview and Compared ETFs
XT is a passively managed ETF that seeks to track the Morningstar Exponential Technologies Index. Therefore, the fund seeks to capture companies that are leading technological advances within various market sectors. With its inception in 2015, the fund has 199 holdings and $3.36B in AUM. By sector, XT is heaviest on information technology at 55.84%, but also includes healthcare (16.08%) and industrials (6.65%). XT also includes international holdings with 6.00% weight in China, 5.79% weight in Japan, and 3.22% weight in Taiwan.
For comparison purposes, other funds examined are ARK Innovation ETF (ARKK), SPDR FactSet Innovative Technology ETF (XITK), and Vanguard Information Technology ETF (VGT). ARKK is an actively managed fund that seeks to capture companies with the theme of “disruptive innovation.” The fund, under Cathie Wood’s Ark Invest, is relatively well-known for rising sharply in 2021 only to burst into steep declines. XITK is less diversified than XT with 101 holdings and captures companies with robust revenue growth that provide leading-edge technologies. Vanguard’s VGT is the most broadly diversified and seeks to capture a sampling of holdings that provide a representative of the returns of the information technology sector.
Performance, Expense Ratio, and Dividend Yield
XT has a 5-year average annual return of 10.46% with a total price return of over 59% over the past five years. This performance has underperformed the S&P 500 Index while seeing significantly greater volatility than the market overall, as I will discuss later. Looking at the peer, comparable funds, ARKK has seen the worst performance with an annualized 5-year return of 1.97%. VGT has seen the best performance with a 5-year average annual return of 23.48%.
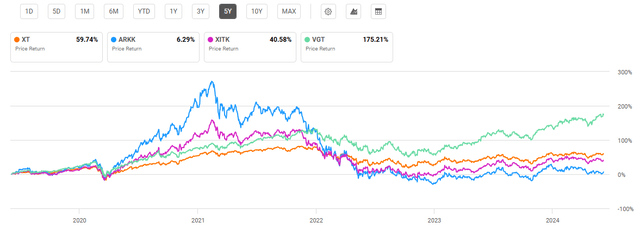
5-Year Total Price Return: XT and Compared Technology ETFs (Seeking Alpha)
XT has an expense ratio of 0.46%, slightly lower than the average expense ratio of all ETFs of about 0.48%. While this is also lower than ARKK’s 0.75%, it is considerably higher than Vanguard’s VGT at 0.10%. Due to the growth-based focus of the companies contained in these ETFs, dividend yields are low. While ARKK and XITK do not offer a dividend yield, XT provides a 0.43% yield. This is lower however than VGT’s dividend yield and has also been shrinking over the past five years.
Expense Ratio, AUM, and Dividend Yield Comparison
|
XT |
ARKK |
XITK |
VGT |
|
|
Expense Ratio |
0.46% |
0.75% |
0.45% |
0.10% |
|
AUM |
$3.36B |
$6.35B |
$119.63M |
$73.52B |
|
Dividend Yield TTM |
0.42% |
N/A |
N/A |
0.65% |
|
Dividend Growth 5 YR CAGR |
-11.86% |
N/A |
N/A |
8.75% |
Source: Seeking Alpha, 6 Jun 24
XT Holdings and Key Risk Factors
Because each of the funds examined have different approaches to capture disruptive innovation and diversified technologies, the compared ETFs have a significantly different holdings mix. XT is also the most balanced in holdings weight with only 8.55% on its top 10 holdings.
Top 10 Holdings for XT and Peer Technology ETFs (Similarities Bolded)
|
XT – 199 holdings |
ARKK – 35 holdings |
XITK – 101 holdings |
VGT – 313 holdings |
|
NVDA – 1.27% |
TSLA – 11.38% |
SMCI – 2.82% |
MSFT – 17.28% |
|
MRNA – 0.91% |
COIN – 9.90% |
NVDA – 2.43% |
AAPL – 15.27% |
|
COIN – 0.88% |
ROKU – 8.43% |
APP – 2.14% |
NVDA – 11.89% |
|
FSLR – 0.88% |
SQ – 5.69% |
PI – 1.91% |
AVGO – 4.40% |
|
MU – 0.86% |
RBLX – 5.46% |
CAMT – 1.66% |
CRM – 2.00% |
|
WDC – 0.77% |
CRSP – 5.38% |
SPOT – 1.56% |
AMD – 1.96% |
|
QCOM – 0.77% |
HOOD – 4.66% |
HCP – 1.55% |
ADBE – 1.60% |
|
TER – 0.75% |
PATH – 3.71% |
MGNI – 1.53% |
CSCO – 1.46% |
|
AVGO – 0.73% |
PLTR – 3.38% |
QTWO – 1.52% |
ACN – 1.44% |
|
AMAT – 0.73% |
ZM – 3.04% |
ONTO – 1.52% |
ORCL – 1.44% |
Source: Multiple, compiled by author on 6 Jun 24
Looking forward, it is likely that XT will likely continue to lag sector-based VGT based on three risk factors. The first risk factor for XT is its holdings, which have seen strong, but potentially unsustainable growth. The second risk factor is the absence of well-established tech holdings with stable revenue streams. The third factor is XT’s inclusion of foreign holdings, representing increased geopolitical risk. Each of these risk factors are discussed in further detail below.
Risk Factor #1: Chasing Returns
The first risk factor for XT is that while the fund seeks to capture companies leading technological advances, these same holdings are typically volatile. Their momentum achieved with technological breakthroughs has seen a tendency to produce outsized gains that are unsustainable. These outsized, potentially unsustainable gains were seen with the top holdings for ARKK over the past five years. The fund has included companies like Block, Inc. (SQ), Roku, Inc. (ROKU), and Zoom (ZM). Each of these holdings experienced periods of tremendous growth and momentum, churning up arguably more hype than growth based on fundamental reality. As a result, the ARKK fund overall saw a 165% price return in 2020. However, as reality set in, the ETF subsequently saw a decline of 77% from peak to trough by late 2022.
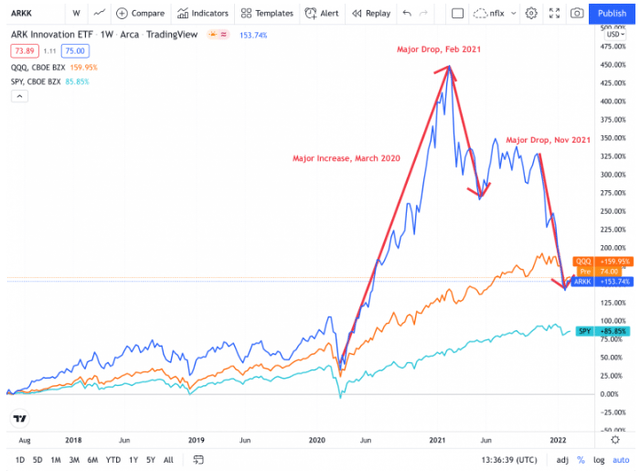
The Rise and Fall of ARKK (Investorplace.com)
Although XT is a passively managed fund compared to ARKK’s active management, XT has several similar negative characteristics seen with ARKK. One common holding between XT and ARKK is Coinbase Global, Inc. (COIN). The cryptocurrency exchange company is up 315% over the past year and currently has a price-to-earnings that is over 300% higher than its sector median. Micron Technology (MU) is another XT holding that has seen a solid one-year 96% return but currently has a very high valuation.
This is not to say that all of XT’s holdings price returns are unjustified. First Solar, Inc. (FSLR), for example, has seen a 58% YTD return but also has seen a YoY EBITDA growth of over 1,000% with a net income margin of almost 30%. Moderna (MRNA), XT’s #2 holding, also has vulnerabilities due to its reliance on its COVID vaccines. This was realized as the company’s share price went up over 1,400% from the outbreak of the pandemic to a high of over $450. However, MRNA has since declined over 60% from its peak. Therefore, XT’s top holdings appear to have a risk factor of “chasing returns” that is akin to the troubles seen with ARKK over the years.
Risk Factor #2: Absence of Well-Established Tech
The second key risk factor is that other than NVIDIA, XT lacks “traditional” big tech holdings like Microsoft (MSFT) and Apple (AAPL). While this risk factor could be considered an advantage by some investors, these big-tech behemoths have provided solid returns through good and bad times. This solid growth is predominantly due to subscription, streaming, and renewable products that provide steady revenue.
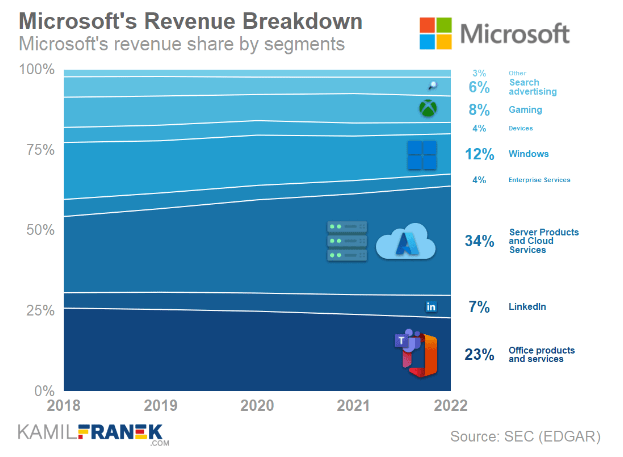
Diverse and Robust Revenue Streams of Microsoft (kamilfranek.com, EDGAR)
However, XT’s top holdings do not have a robust variety of revenue segments. For example, First Solar, XT’s #4 holding, receives revenue from just two divisions: photovoltaic systems and photovoltaic modules. While these segments have seen revenue growth, they are concentrated and dependent on the solar and broader renewable energy market. Another example is Coinbase, XT’s #3 holding. While COIN has taken measures to diversify its revenue streams, it too is reliant on just a few core sources, including cryptocurrency transactions.
Risk Factor #3: Chinese Holdings
The third risk factor for XT is the inclusion of foreign holdings. One example of a holding for XT that represents risk is its #11 holding, China Resources Power Holdings Company Limited (HKG:836). In 2016, a top executive of China Resources Power was sentenced to 10 years in prison for bribery and embezzlement. While China Resources makes up less than 1% of the fund’s weight, there is a total of 15.01% weight on foreign holdings. Beyond corruption concerns and inefficiencies with state-owned companies, there are also geopolitical risks and the potential for tariffs. Former President Trump has proposed a 10% tariff on imported goods, which would have significant implications for foreign holdings, including those contained within XT depending on the results of the next election.
Current Valuation
XT and the other compared funds examined have performed roughly on track with their own 5-year historic returns. While XT has yielded a modest 8% this past year, VGT has strongly outperformed with a 30% price return. Actively managed ARKK has seen the weakest performance at 6.4%.
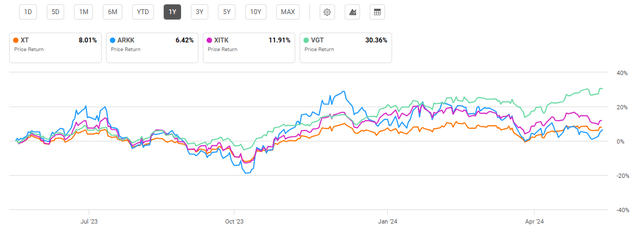
One Year Performance: XT and Compared Technology ETFs (Seeking Alpha)
As a result of XT’s recent underperformance, it has the most attractive price-to-earnings and price-to-book ratios. However, for the multiple risk factors discussed, I do not see a low P/E and P/B as a convincing reason to buy the fund. ARKK saw the highest P/E driven predominantly by a high price of Tesla (TSLA), its top holding. Although VGT has a higher valuation than XT, I see it as a more compelling buying opportunity due to its diversification and holdings with strong fundamentals.
Valuation Metrics for XT and Peer Competitors
|
XT |
ARKK |
XITK |
VGT |
|
|
P/E ratio |
20.82 |
51.13 |
26.51 |
33.90 |
|
P/B ratio |
3.10 |
7.28 |
3.99 |
7.70 |
Source: Compiled by Author from Multiple Sources, 6 Jun 24
Risks to Investors
All funds examined have unique risk factors due to their heavy weight on technology companies. This risk can be seen with each fund’s volatility, which is more pronounced than the market overall. The volatility can be measured by examining beta values and standard deviations. For example, XT has a 5-year beta of 1.21 along with a 3-year standard deviation of 21.78%. By comparison, VGT has seen slightly higher volatility with a 1.27 beta and 23.64% standard deviation. However, neither one of these funds are close to the volatility of ARKK, which saw a 3-year beta of 1.85 and standard deviation of 46.05%. I have written in previous articles about how the market overall is at significant risk of correction. In the event of a correction or bear market, all funds including XT and VGT, will likely experience declines greater than the market overall due to their historic volatility.
Concluding Summary
XT warrants a hold rating due to its multiple risk factors that will likely outweigh returns for the fund. As an alternative, I find VGT to be superior on several levels, including lower fees, a higher dividend yield, and more diversified, well-established holdings. Despite XT’s passively managed approach, it displays some of the riskier characteristics that are seen in ARKK.
Read the full article here