

This article was published on Dividend Kings on Tuesday, May 30th.
—————————————————————————————
Two weeks ago, I issued a rare valuations-based downgrade on NVIDIA Corporation (NASDAQ:NVDA) ahead of earnings.
My thesis was simple. Nvidia was the best performing big tech name of 2023, up over 100% YTD, driven by optimism about artificial intelligence, and specifically NVDA’s $10,000 H-100 chips.
I explained how several key risks could result in NVDA missing earnings for the first time in 3.5 years. And thanks to being priced for almost 50% growth and trading at a 70+% premium (82% the day of earnings), NVDA could potentially crash 20% to 30% in a single day.
NVDA shocked Wall Street and me with a great Q1 earnings report and guidance that was pure blowout. In fact, the results were so spectacular that the stock soared 24% the next day.
Charlie Bilello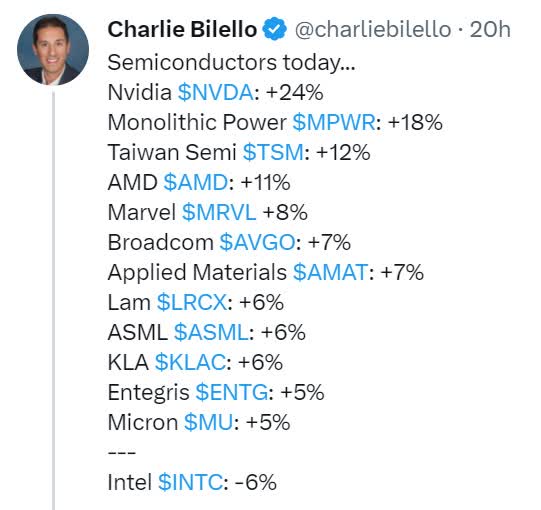
The guidance was so strong that all major chipmakers other than Intel Corporation (INTC) soared in sympathy.
NVDA, at one point on post-earnings day, was up 30%, having gained $240 billion in market cap. That’s twice the value of Intel.
Statista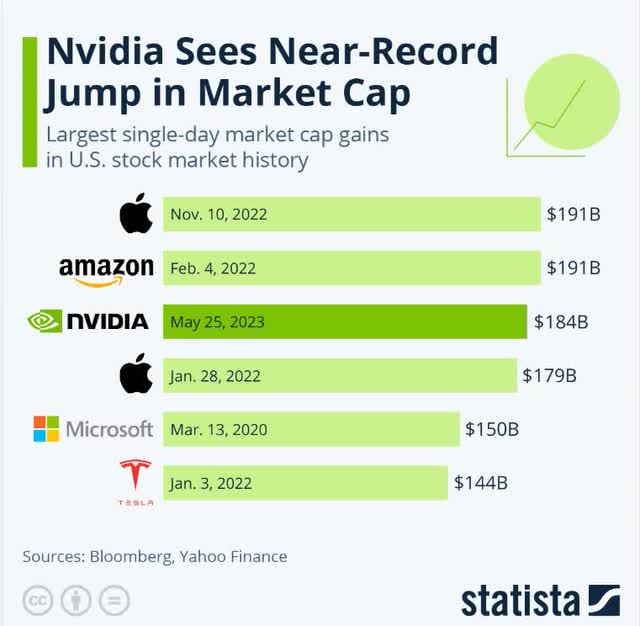
It closed up $184 billion, the 3rd largest single-day gain in market cap in U.S. stock market history.
I’m more than willing to admit when I’m wrong, and I was dead wrong on my short-term NVDA downgrade.
When the facts change I change my mind. What do you do sir?” – John Maynard Keynes.
So let’s look at just how amazing NVDA’s earnings were, what it likely means for the company’s long-term future, and why this is one of the best ways to invest in the AI revolution long-term.
However, there is an important warning I must point out that could result in a significant correction in NVDA shares that could begin as soon as next week.
In other words, let’s look at 11 billion reasons why long-term investors might want to buy NVIDIA and 1.5 trillion reasons why they might want to hold or even trim their positions.
11 Billion Reasons To Buy Nvidia
Statista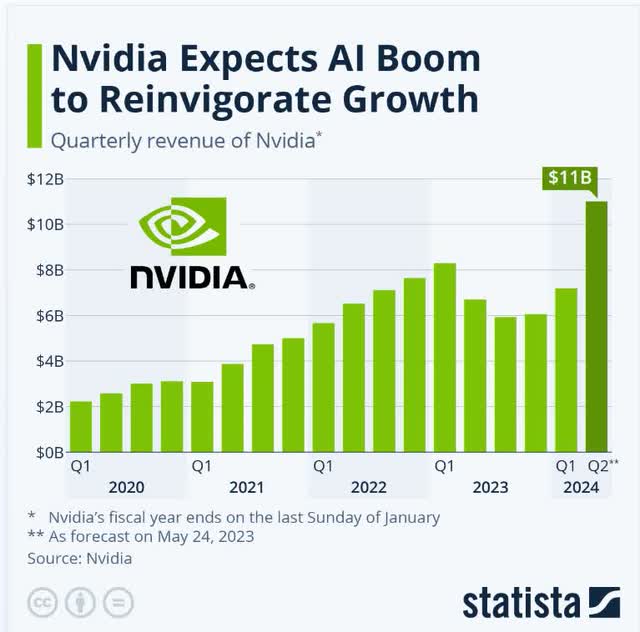
This is the biggest reason for NVDA’s explosive stock rally after earnings.
Management issued sales guidance that was over 50% higher than consensus estimates. It’s not just a record $11 billion for the next quarter. It’s also 33% higher than the company’s highest revenue in history.
Management expects second-quarter revenue to be at a midpoint of $11 billion, which would be up 64% year over year and 53% sequentially.” – Morningstar (emphasis added).
Few large companies have ever been able to generate 64% sales growth even coming out of a recession, much less going into one.
We are raising our fair value estimate to $300 per share from $200 per share as we raise our forecast for Nvidia’s data center segment revenue to grow at a 30% CAGR over the next five years (up from 19% previously).” – Morningstar.
Analysts have been racing to increase their growth and earnings estimates for this year and future years due to NVDA’s blowout guidance.
- 2023 earnings per share consensus up from $4.48 to $6.91 (up 54%)
- 2024 EPS consensus is up from $6.02 to $9.50 (up 58%).
My own fair value estimate is up from $172 to $272 (up 58%) as earnings estimates have soared.
“The uplift is primarily driven by unsatiated demand for Nvidia’s latest H100 data center GPU. Relative to its predecessor, the H100 is nine times faster in artificial intelligence training and up to 30 times faster in AI inferencing for transformer-based large language models such as Open AI’s ChatGPT (generative pre trained transformer). We believe AI models such as ChatGPT use thousands of GPUs to be trained, with competition between Microsoft, Google, and others supporting our updated growth projections.” – Morningstar (emphasis added).
The key to NVDA’s blowout guidance is shockingly strong demand for its $10,000 H-100 AI chips. The H100 is the industry leader in AI chips and in the current arms race between giant tech firms training up their large-language models or LMMs, NVDA is facing a gold rush.
Gaming sales were down 38%, and data center was up 14%, but right now, the only thing anyone cares about is AI chips.
For context, the $11 billion sales guidance NVDA just put out would represent 100% year-over-year growth, which is absolutely remarkable for a company of its size.
NVDA’s Short-Term Growth Prospects Are Sensational
| Metric | 2022 Growth | 2023 Growth Consensus (recession) | 2024 Growth Consensus |
2025 Growth Consensus |
| Sales | 1% | 59% | 23% | 22% |
| Dividend | 0% | 6% | 18% | 10% |
| Earnings | -25% | 128% | 30% | 21% |
| Operating Cash Flow | -37% | 212% | 40% | 9% |
| Free Cash Flow | -47% | 236% | 46% | -2% |
| EBITDA | -36% | 194% | 31% | 17% |
| EBIT | -44% | 285% | 29% | 22% |
(Sources: FAST Graphs, FactSet Research Terminal.)
I want to point out some important facts here.
First, if NVDA can live up to its newest consensus estimates, then it will be one of the fastest-growing companies in the 2023 recession.
- 128% EPS growth
- 212% operating cash flow growth
- 236% free cash flow growth.
Analysts also expect the dividend to start growing again after being frozen for almost three years.
But note the highly leveraged nature of NVDA’s business. When sales grow 59%, earnings grow more than twice as fast, and free cash flow almost four times as fast.
NVDA’s Volatile Fundamentals Create Some Of The Largest Bear Markets On Wall Street
| Bear Market | Nvidia | 60/40 | S&P |
| 2022 Stagflation | -63% | -21% | -28% |
| Pandemic Crash | -2% | -13% | -34% |
| 2018 Recession Scare | -52% | -9% | -21% |
| 2011 Debt Ceiling Crisis | -38% | -16% | -22% |
| Great Recession | -79% | -44% | -58% |
| Tech Crash | -87% | -22% | -50% |
| Average | -54% | -21% | -34% |
| Median | -58% | -19% | -31% |
(Source: Portfolio Visualizer Premium.)
In 2021, NVDA saw a massive Pandemic-fueled cash flow boom of 55% before it fell 37% in 2022 due to the cyclical nature of its industry.
Free cash flow (“FCF”) was cut in half, helping fuel a 63% crash in 2022.
FactSet Research Terminal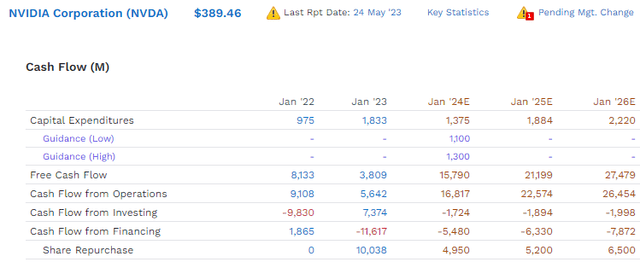
Speaking for free cash flow by 2026, NVDA’s free cash flow is expected to hit $27.5 billion, representing a mind-blowing 43% free cash flow margin.
- top 5% of all companies on earth.
Buybacks are expected to steadily ramp up though not to meaningful levels, given it’s nearly $1 trillion market cap.
However, while NVDA longs have reason to celebrate, especially long-term investors like my Dividend Kings colleague Nicholas Ward ($37 cost basis), there are 1.5 trillion reasons to be cautious about NVDA in the short-term.
1.5 Trillion Reasons To Not Buy Nvidia Right Now
As Morgan Stanley’s Mike Wilson pointed out on Bloomberg on Friday, and as confirmed by Bank of America and many other investment banks, there is one big tailwind that big tech stocks have enjoyed that is about to go into reverse.
Have you wondered how it’s possible that stocks have been going up ahead of a recession that the economic data says is between 5 weeks and five months from starting?
- the S&P 5 (5 biggest stocks) median returns are 35% this year
- the S&P 495 (everything else) median return is -2%.
Cyclical, recession-sensitive stocks are down 33%.
Daily Shot 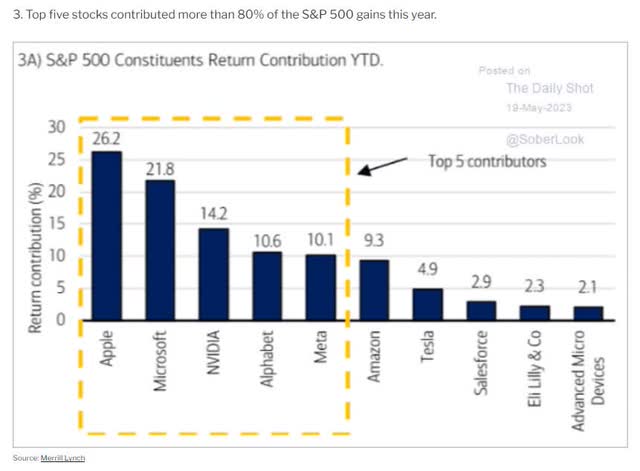
It’s always and forever a market of stocks, not a stock market, but few times in history have that been more true than this year.
But here is the biggest risk to the stock market in the very short term.
Liquidity.
The think the Fed was pumping almost continuously for 15 years and that the Fed reversed in 2022.
Charlie Bilello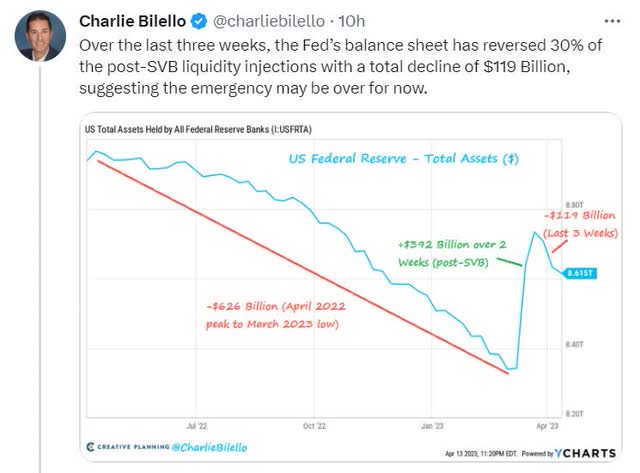
While quantitative tightening has never stopped, the Fed did emergency lending to the tune of $400 billion during the banking crisis, which temporarily increased liquidity.
But this is now back to a negative trend, and there is a much bigger liquidity trap coming that most people don’t know about but has been staring us right in the face all year.
Debt Ceiling Crisis Is About To End
Daily Shot 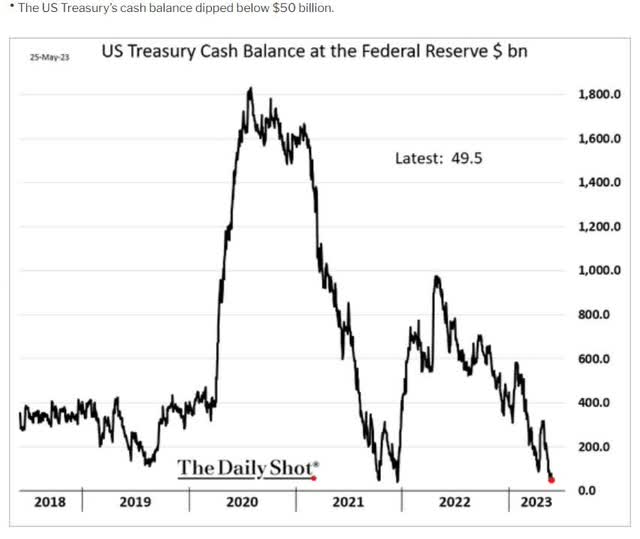
For weeks, I’ve been covering the debt ceiling crisis and the economic and market ramifications a default would likely bring.
A deal has been reached, and the House plans to vote on Wednesday and the Senate on Friday.
US Treasury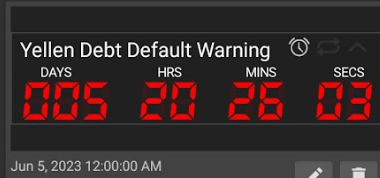
If no one in the Senate filibusters and the bill can pass the House, then we should be OK in terms of avoiding default.
So what’s the problem? The U.S. treasury likes to keep around $600 to $800 billion in its account, and it is almost down to zero.
Guess what that means happens the day the debt ceiling is raised? The treasury will start selling U.S. bonds again, lots of them.
According to Bank of America and Morgan Stanley:
- $550 billion by the end of June
- $1.2 trillion by the end of September
- $1.5 trillion by the end of the year.
So why should stock investors care if the U.S. treasury is selling bonds?
Because that money has to come from somewhere.
Charlie Bilello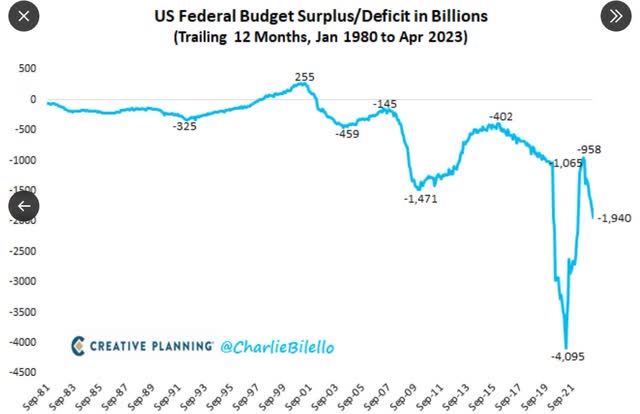
The U.S. Treasury, outside of debt ceiling crises, is constantly selling new U.S. bonds.
When we hit the debt ceiling, the Treasury has to stop and drawdown its General Account.
What happens when there is normally a steady stream of money flowing out of the financial market and into bonds? It reduces liquidity. What happens when that stream shuts down for 6 months?
For almost all of 2023, the U.S. Treasury has effectively been “printing money.” to the tune of about $600 billion.
Since March, the Fed effectively “printed” $120 billion.
But now the banking crisis is normalizing, and the Fed is back to $120 billion per month in negative money printing.
- By the end of the year, $720 billion in scheduled reverse money printing by the Fed.
And the US Treasury is about to sell $1.5 trillion, sucking that out of the US economy and financial markets by the end of the year.
- $2.22 trillion in reduced liquidity by the end of the year
Bottom Line: Nvidia’s Explosive Growth Is Great, But Valuation Remains Speculative, And The Music Could Stop Next Week
When NVDA booms, it booms; when times get tough, they get really tough.
It’s very rare for NVDA’s corrections to be mild. When this hyper-volatile hyper-growth blue-chip falls, it tends to crash. This creates incredible opportunities for long-term investors.
NVDA’s Volatile Fundamentals Create Some Of The Largest Bear Markets On Wall Street
| Bear Market | Nvidia | 60/40 | S&P |
| 2022 Stagflation | -63% | -21% | -28% |
| Pandemic Crash | -2% | -13% | -34% |
| 2018 Recession Scare | -52% | -9% | -21% |
| 2011 Debt Ceiling Crisis | -38% | -16% | -22% |
| Great Recession | -79% | -44% | -58% |
| Tech Crash | -87% | -22% | -50% |
| Average | -54% | -21% | -34% |
| Median | -58% | -19% | -31% |
(Source: Portfolio Visualizer Premium.)
That’s because volatility cuts both ways.
Nvidia‘s Best Bull Markets Off Bear Market Lows
| Time Frame (Years) | Annual Returns | Total Returns |
| 1 | 751% | 751% |
| 3 | 140% | 1284% |
| 5 | 89% | 2340% |
| 7 | 81% | 6381% |
| 10 | 57% | 9222% |
| 15 | 34% | 7611% |
(Source: Portfolio Visualizer Premium.)
Coming off a crash when investor sentiment turns overly bearish, NVDA is one of the best companies you can buy.
But today? The good news is that NVDA’s explosive guidance surprise means it’s no longer 82% overvalued like it was going into earnings.
But the bad news is that it’s conservatively 43% overvalued.
- Dividend Kings Quality Score: 95% very low risk (91st S&P percentile risk management) 13/13 Ultra SWAN chip maker
- fair value: $271.64
- current price: $389.46
- discount: -43%
- DK rating: hold.
Is it possible that NVDA’s future market-determined fair value will be permanently higher than it has been in the past?
Sure, but this is speculative because take a look at what NVDA’s growth outlook looks like today.
FactSet Research Terminal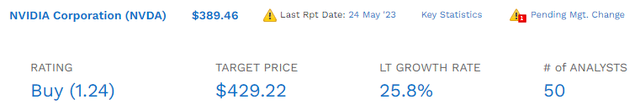
Pre-earnings analysts expected 21.8% long-term growth from NVDA, and by Friday, it was up to 30%, and now it’s fallen back to 26%.
| Metric | Historical Fair Value Multiples (All Years) | 2022 | 2023 | 2024 | 2025 | 12-Month Forward Fair Value |
| PE | 33.93 | $745.10 | $234.46 | $322.34 | $905.25 | |
| Average | $745.10 | $234.46 | $322.34 | $905.25 | $271.64 | |
| Current Price | $389.46 | |||||
|
Discount To Fair Value |
47.73% | -66.11% | -20.82% | 56.98% | -43.38% | |
|
Upside To Fair Value (including dividend) |
91.32% | -39.80% | -17.24% | 132.44% | -30.21% | |
| 2023 EPS | 2024 EPS | 2023 Weighted EPS | 2024 Weighted EPS | 12-Month Forward PE | Historical Average Fair Value Forward PE |
Current Forward PE |
| $6.91 | $9.50 | $3.99 | $4.02 | $8.01 | 33.9 | 48.6 |
NVDA’s historical growth rate of 22% has been valued by billions of cumulative investors over 20 years at 34X earnings.
Is 4% faster long-term growth worth 50X earnings?
NVDA Historical Earnings Growth
FAST Graphs, FactSet FAST Graphs, FactSet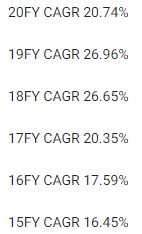
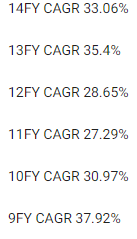
NVDA’s growth rates over the last 20 years, outside of single-year declines, have ranged from 15% to 43% annually.
What is NVDA’s market-determined historical fair value range? 30 to 37 times earnings while growing at 15% to 43% annually, outside of bear markets and bubbles.
In other words, AI isn’t likely to increase NVDA’s long-term fair value multiples unless NVDA can permanently grow faster than 43% due to AI.
- analyst growth consensus range: 10% to 73%
- median 25.8%.
Do you know how many analysts out of 50 that cover NVDA for a living think it can grow faster than 43% and thus potentially justifies a permanently higher multiple?
Just one, Ross Seymore at Deutsche Bank, with a rather outlandish 73% long-term growth forecast.
NVDA is a massive, fast-growing company, and AI is expected to keep it growing at incredible rates. But is it worth almost 50X earnings today? Or 45X cash-adjusted earnings?
Nvidia 2025 Consensus Total Return Potential
FAST Graphs, FactSet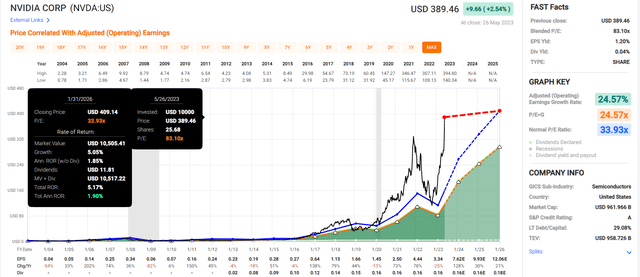
Nvidia Corporation’s explosive growth is completely priced in for the next three years. If NVDA grows as expected and returns to its 20-year historical market-determined fair value of 34X earnings (while growing at the same rate analysts currently expect:
- 2026: 48% total return = 10% annually
- 2027: 89% total return = 13.6% annually
- 2028: 138% total return = 15.6% annually
- 2029: 199% total return = 20.0% annually.
NVDA has the potential to triple in the next six years IF it grows as expected and returns to historical fair value.
But along the way, it’s likely to suffer a massive crash. Remember, the median bear market for NVDA is historically almost 60%.
And in the short-term?
Liquidity on its own doesn’t guarantee that stocks go up or down in the short term. But it creates massive headwinds or tailwinds.
In 2022 the Fed was tightening conditions at the fastest rate in 42 years. And NVDA crashed 63%.
In 2023 so far, the Fed has printed money yet again, and the Treasury effectively joined in with $600 billion in money printing.
That’s $720 billion in liquidity injections in 5 months.
- exactly the rate of QE during the Pandemic.
Wonder why big tech has been flying so high in 2023? Because the government is back to Pandemic levels of money printing.
But as of June 5th, when the debt ceiling will be raised again, we’re back to reverse money printing, and at the fastest rate in recorded history.
- $2.22 trillion in effective reverse money printing in five months
- $444 billion per month vs. $120 billion in 2022 from the Fed
- Fed QT X 4 is coming next week.
Imagine if the Fed had announced it was going to quadruple QT in 2022. Do you think that stocks would have done worse or better?
That’s literally what is about to happen as soon as the President signs the debt ceiling increase into law between Friday and Sunday.
What Nvidia Investors Should Do Now
- long-term investors who bought at fair value or better are free to ignore all this and don’t pay taxes unnecessarily
- short-term traders are warned that the QE music is about to stop on June 5th.
Read the full article here