


Canine’s looking for 9% or higher
How are you feeling about interest rates lately?
I’m a bit bothered by the move higher.
We’ve seen rates moving higher, but we’ve also seen share prices rally on some of our income investments.
I want to discuss a new one we added to coverage recently.
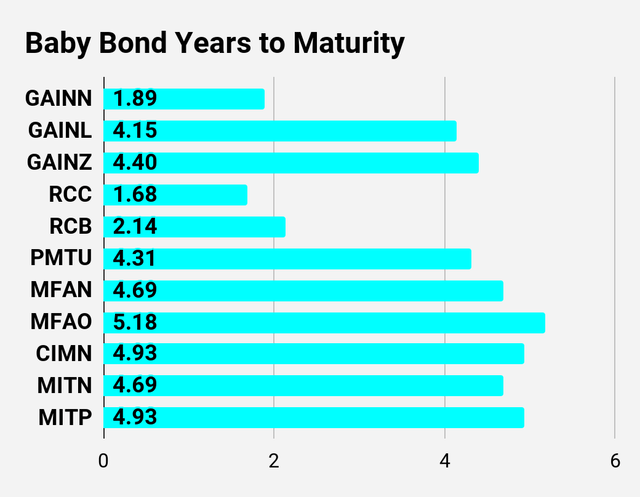
Chimera Investment Corporation (CIM) has a baby bond (CIMN).
We wrote our first report on it on May 30th, 2024. I’m going to include part of that report below, along with a brief update.
The update section and the tables in this article will utilize the latest prices from June 10th, 2024. However, the prices are pulled while the market is open, so they could still change by the close.
Summary Card
I put together one of our cards for CIMN. I’m considering adding these (for all baby bonds) to the sheets for members. We already have these cards for preferred shares, so it would only be a moderate amount of extra work.
The REIT Forum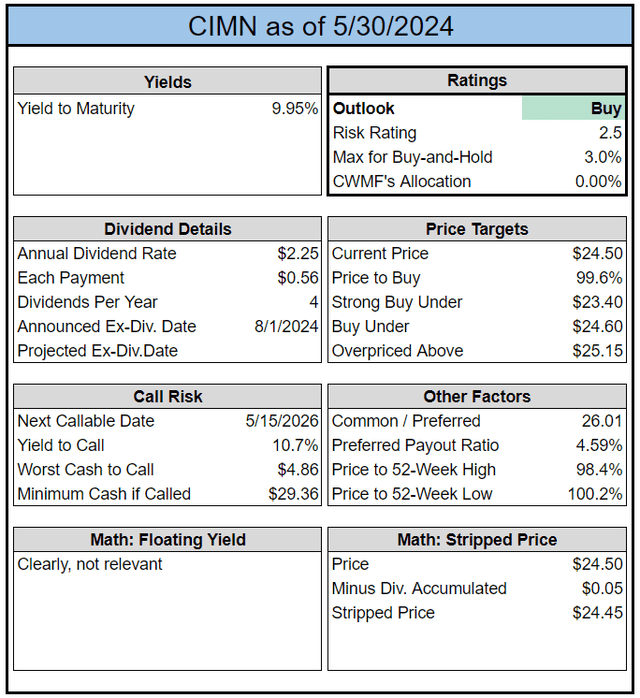
Notes About CIMN
This is a new baby bond and it’s been trading pretty weak.
Shares fell from the $24.70s down to $24.50 (as of 5/30/2024).
For a new share, liquidity feels a bit weak so far.
Underwriters (the big sellers) might be hesitant to sell shares under $24.50.
Given the weak liquidity so far, I’ll be hesitant to initiate a large position.
However, valuation looks reasonable for starting a position.
The yield to maturity at 9.95% is pretty good.
CIM Preferred Shares
I currently have a position in CIM-D (CIM.PR.D), one of the preferred shares.
Those shares are trading at $24.85, but they have nearly a full quarter of dividend accrual. Since shares are floating, that’s around $.70 (rounded).
The floating yield on CIM-D is about 11.37%.
CIM-B (CIM.PR.B) and CIM-D each have floating yields over 11.3%, but the upside to call value isn’t substantial.
Since CIM-D’s floating yield is about 11.37% and CIMN has a yield to maturity of 9.95%, the spread isn’t huge.
I’m inclined to favor CIMN in this scenario.
If the spread is only about 1.4%, I would want to see more upside in the preferred share price to justify the incremental risk.
This is especially true when interest rate cuts over the next year are more likely than increases.
The Ex-Dividend
I’ll think about swapping my CIM-D for CIMN, but the CIM preferred shares go ex-dividend on 06/03/2025.
I think there’s a decent chance that the preferred share price falls by less than the ex-dividend amount.
This can happen more frequently when shares are trading pretty close to $25.00.
CIM-D doesn’t appear to be a perfect target since shares are at $24.85 (already a $.15 discount).
However, CIM-B has a higher yield (due to a bigger floating spread) and is trading right at $25.00.
Since some investors will scan for shares under $25.00 with a high yield, they would be more likely to notice these shares right after the ex-dividend than right before.
I think CIM-B’s higher yield while sitting right at $25.00 could be creating a bit of a soft ceiling for prices.
Consequently, I’m a bit hesitant to close out the position before the ex-dividend.
On the other hand, CIM-D has achieved 102.1% of our target price (which updates daily for dividend accrual).
CIMN is slightly below our target price and less risky.
So, if we ignored the potential for a slight boost to performance around the ex-dividend date, I would easily pick CIMN over the CIM preferred shares.
A Tax Note
We don’t do tax advice. It isn’t our area of expertise. We do stock analysis. We evaluate cash flows.
However, this may be relevant for some investors.
The CIM preferred shares might get the 199A deduction. CIM preferred shares qualified for 199A last year. I would expect that to continue, but the lifespan of the 199A deduction is questionable. It’s expected to end at the end of 2025. While the 199A deduction is available, the preferred share classification may be favorable for some investors. I’m pushing our high-yield positions (which heavily overlap with the active trading positions) through tax-advantaged accounts. Consequently, the tax difference isn’t relevant to me.
Conclusion
I’ll be thinking about swapping my CIM-D for CIMN.
CIM-D is currently $24.85 vs. CIMN at $24.50. A spread of $.35.
If CIM-D fell by $.70 on the ex-dividend date (06/03/2024), shares would hit $24.15.
Therefore, the projected gap would be about negative $.35 ($24.15 vs $24.50) after the ex-dividend date.
I might swap before or after the ex-dividend date. The gap in yields certainly favors CIMN for me.
Note: “after” doesn’t necessarily mean on 06/03/2024 or immediately thereafter. If shares fell by $.70, I could sit there for a few days or even a couple of weeks just to see if we get a bounce from bargain hunters noticing the shares.
As I look for ways to pull back a little on risk while maintaining a respectable yield, these trades can be a great fit.
This is my foreshadowing about two potential moves.
One is that I may look to close out my position in CIM-D. The other is that I may look to buy CIMN.
Both potential trades depend on valuation.
Update
Now let’s get into the changes since we prepared that report.
- Change 1: CIM-D went ex-dividend.
- Change 2: I followed through on my potential sale of CIM-D at $24.36, after the ex-dividend. That’s pretty good since we collected that big dividend. About $.69 to $.70. Shares aren’t absurdly expensive, but we got the big returns we were looking for. Our positions in CIM-D returned 25% and 28% respectively. Not bad for under 9 months. I’ll share more details on this choice in the future.
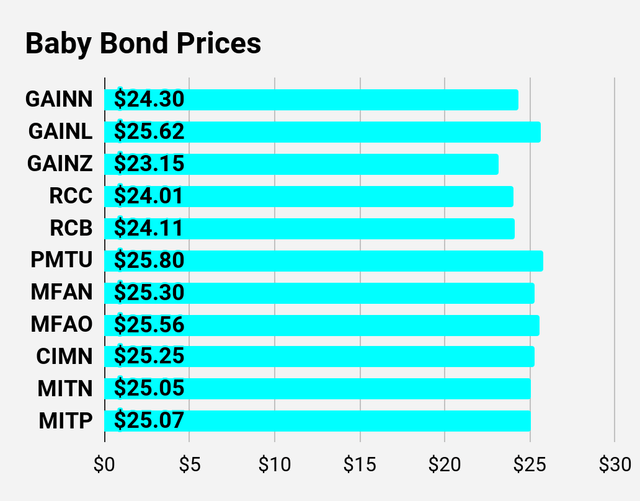
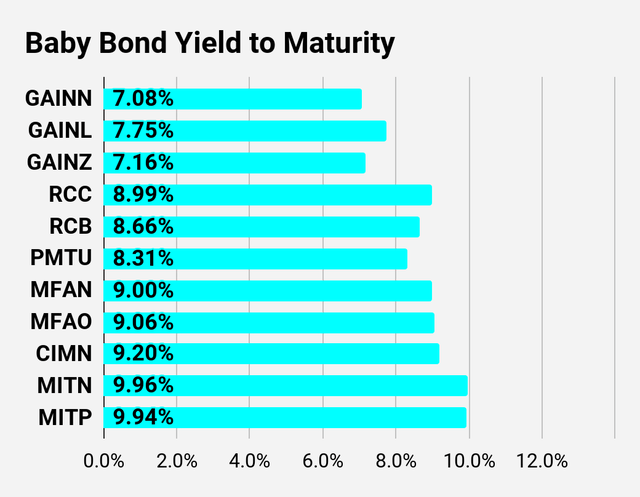
- Change 3: CIMN rallied quite a bit. It’s trading at $25.24 now. I was hoping it wouldn’t rally so soon, since I was interested in buying shares. The yield to maturity declined quite a bit as a result of the higher price. Now the yield to maturity is about 9.21%. That’s lower than the 9.95% from the initial report.
It may seem strange that the yield to maturity is higher than the 9% coupon rate when CIMN trades at $25.24 today and has less than $.24 of dividend accumulation. However, baby bonds pay out interest quarterly. The quarterly compounding results in a higher yield to maturity than if the baby bond only paid out interest after a year.
Since the shares of CIMN rallied by $.74 in those 10 days, I decided to just sit my extra cash in a Treasury bill ETF briefly. I’ll probably put it to work again soon.
Preferred Share Guide
If you’re interested in preferred shares, make sure to check out our huge free guide to preferred shares.
Many readers have told me it’s their primary resource for learning how preferred shares work.
It took a few years to bring it all together, so I hope readers enjoy it.
Stock Table
We will close out the rest of the article with the tables and charts we provide for readers to help them track the sector for both common shares and preferred shares.
We’re including a quick table for the common shares that will be shown in our tables:
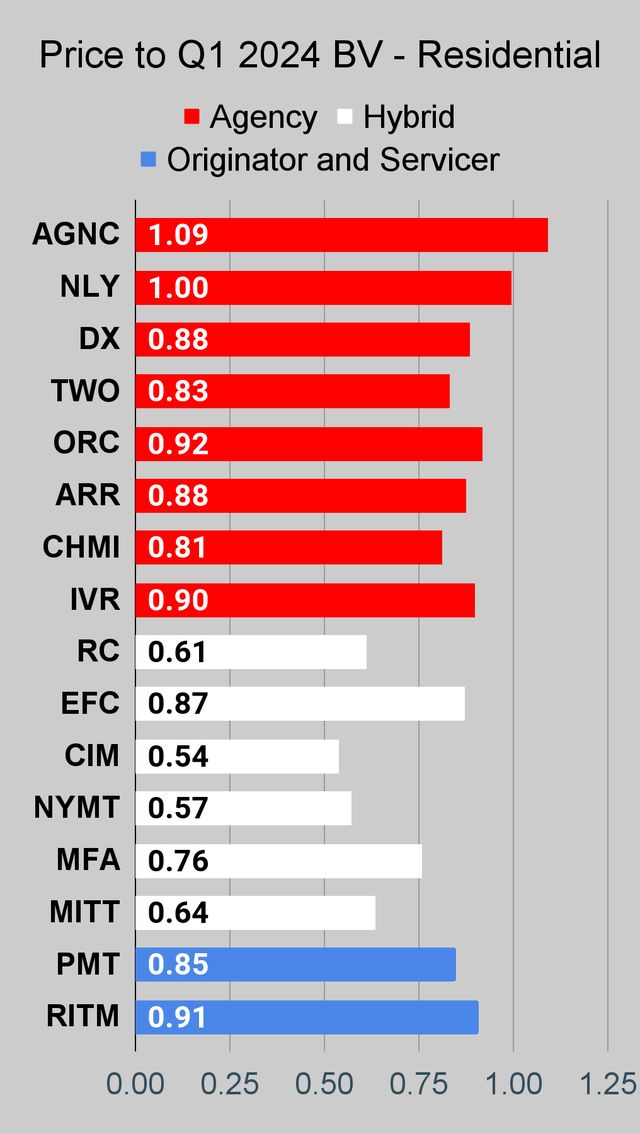
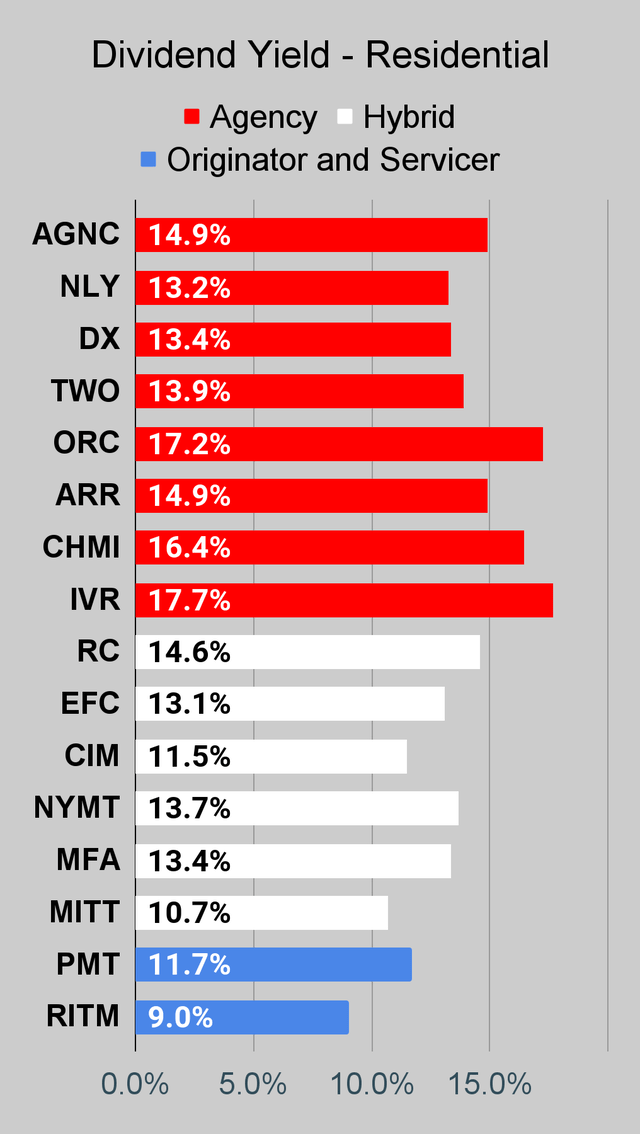
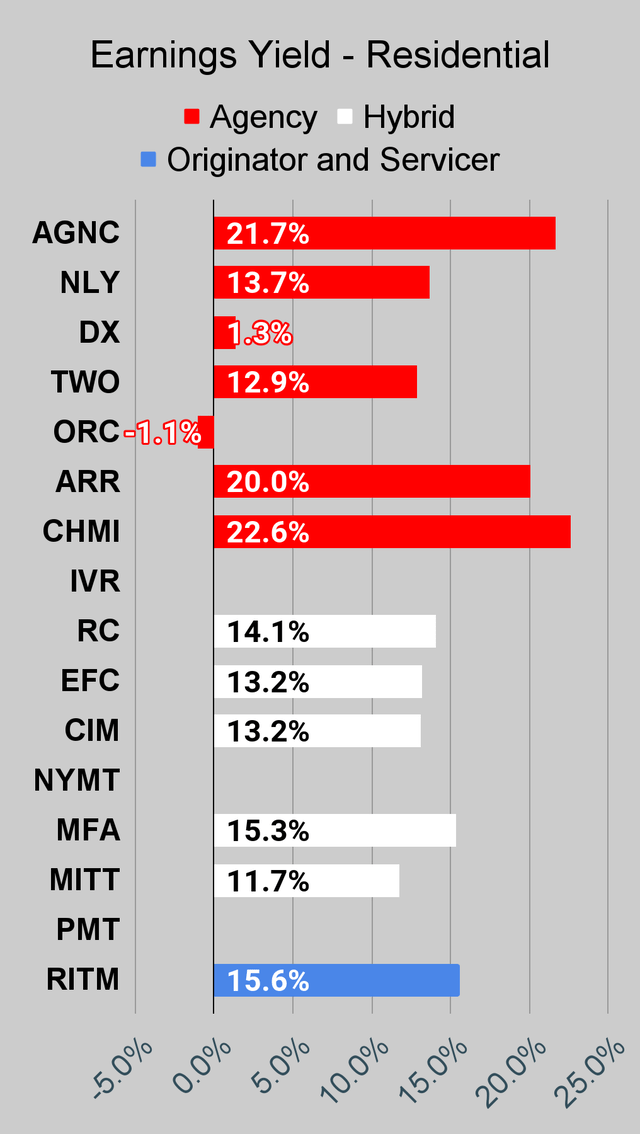
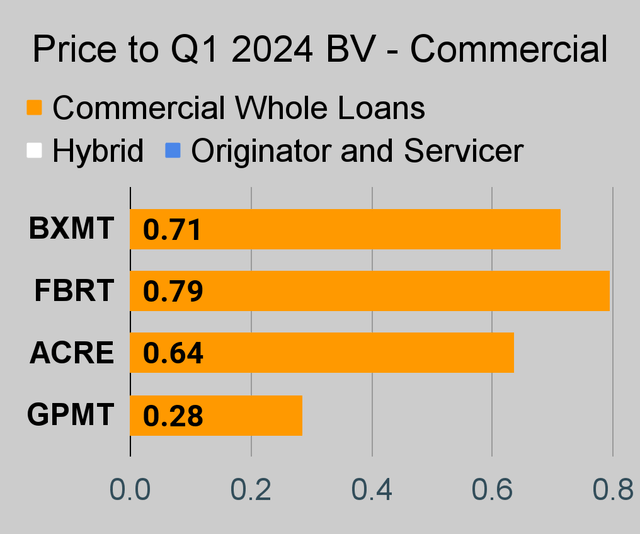
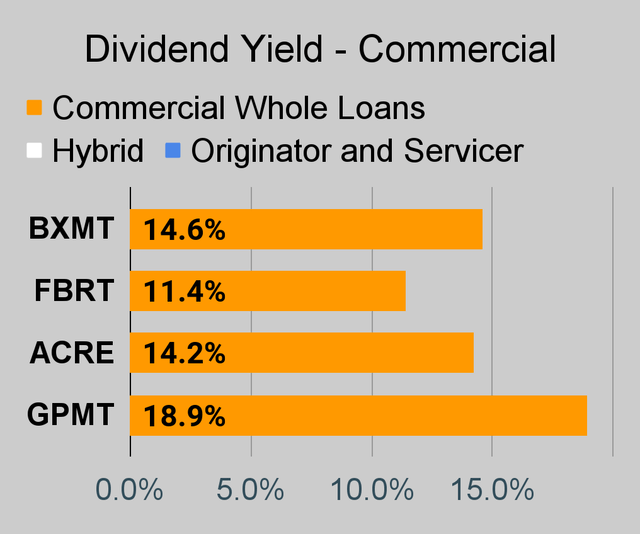
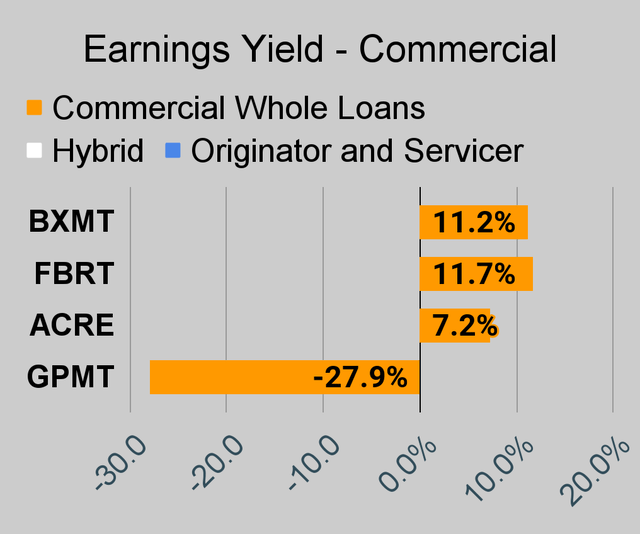
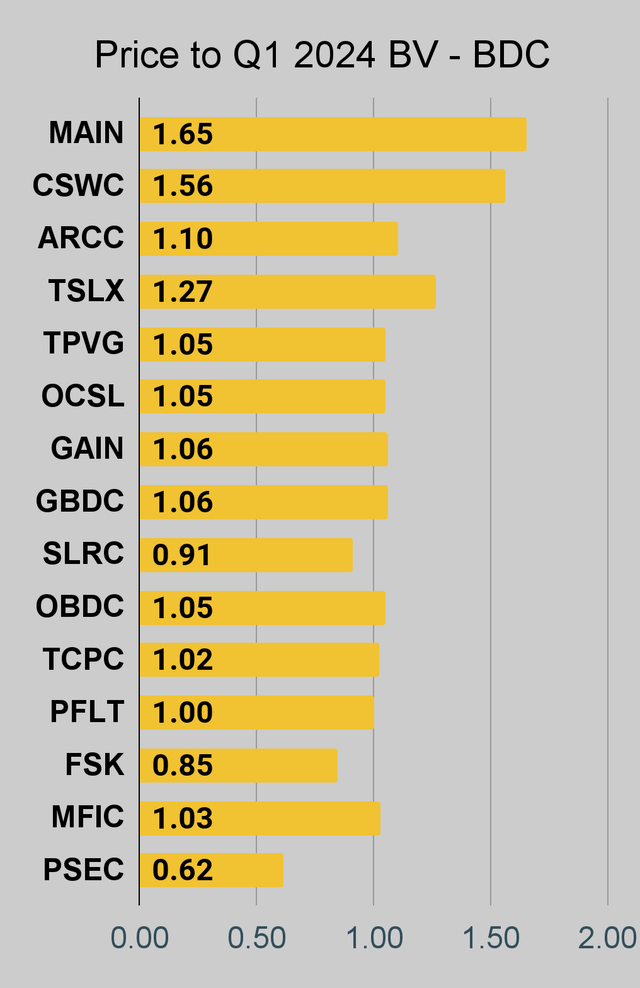
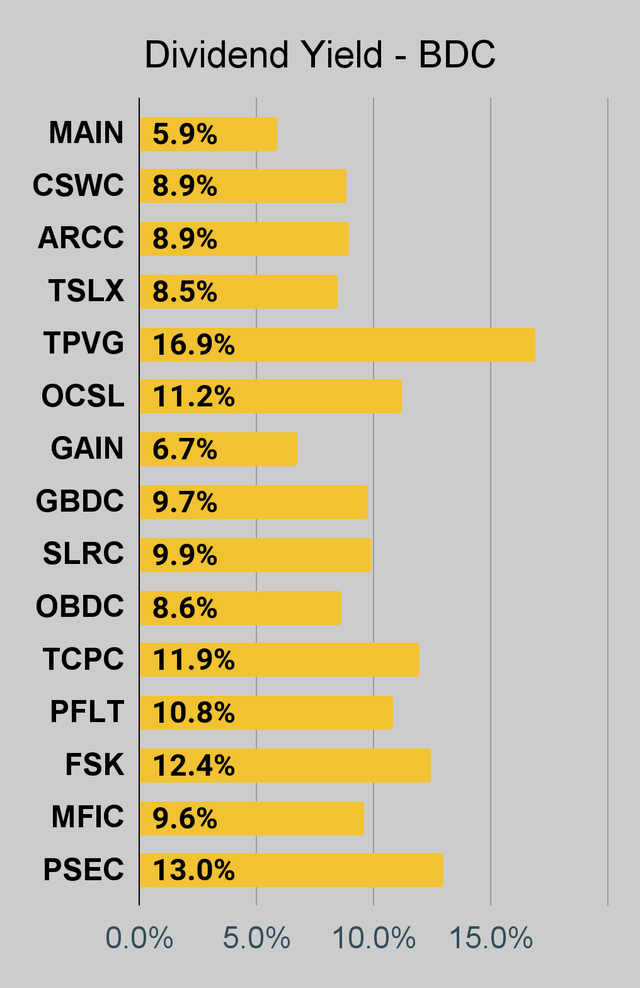
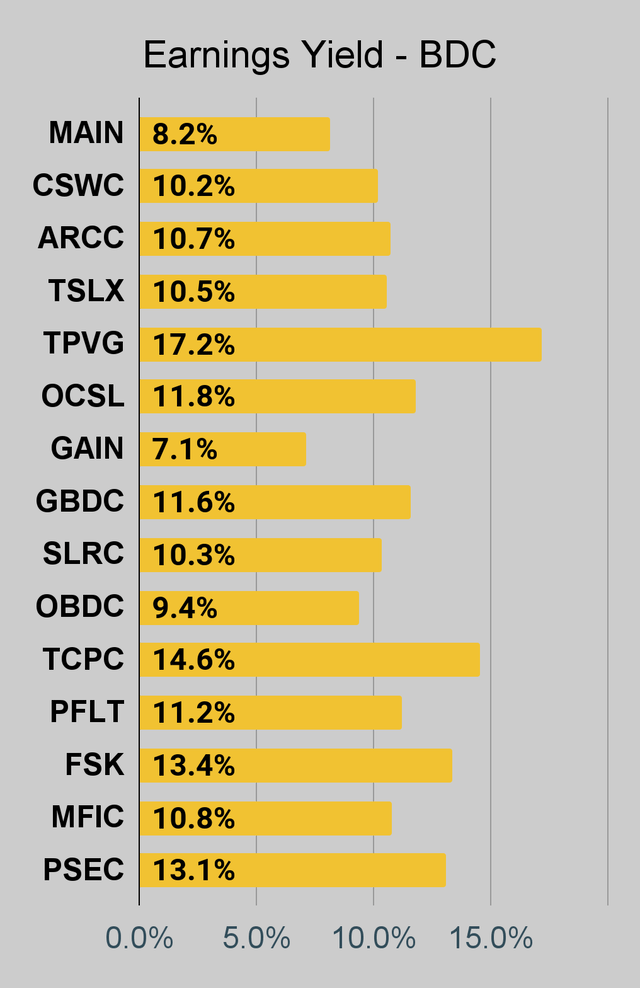
If you’re looking for a stock that I haven’t mentioned yet, you’ll still find it in the charts below. The charts contain comparisons based on price-to-book value, dividend yields, and earnings yield. You won’t find these tables anywhere else.
For mortgage REITs, please look at the charts for AGNC, NLY, DX, ORC, ARR, CHMI, TWO, IVR, CIM, EFC, NYMT, MFA, MITT, AAIC, PMT, RITM, BXMT, GPMT, WMC, and RC.
For BDCs, please look at the charts for MAIN, CSWC, ARCC, TSLX, TPVG, OCSL, GAIN, GBDC, SLRC, OBDC, PFLT, TCPC, FSK, PSEC, and MFIC.
This series is the easiest place to find charts providing up-to-date comparisons across the sector.
Notes on Chart Sorting
Within each type of security, the sorting is usually based on risk ratings. However, it is quite common to have a few shares that are tied. When the shares are tied for risk rating, the sorting becomes arbitrary. There may occasionally be errors where a share’s position is not updated quickly following a change in the risk rating. That can happen because the charts come from a separate system. When I update the system we use for members, it doesn’t change the order in the charts.
When I say “within each type of security”, I’m referencing categories such as “agency mortgage REITs”. The “hybrid mortgage REITs” are all listed after the “agency mortgage REITs”. However, that does not mean RC (lowest hybrid) has a higher risk rating than the highest agency mortgage REIT. Each batch is presented by themselves.
PMT and RITM are tied for risk rating.
This could probably be written better. If someone feels inclined to take it upon themselves to write a section that is objectively better at communicating these points, I would be interested in using it. I’m grateful to have the best readers on SA. I attribute this to self-selection bias. I include enough things to offend the dumb people that I’m left with the best readers.
Note: The chart for our public articles uses the book value per share from the quarter indicated in the chart. We use the current estimated (proprietary estimates) book value per share to determine our targets and trading decisions. It is available in our service, but those estimates are not included in the charts below. PMT and NYMT are not showing an earnings yield metric as neither REIT provides a quarterly “Core EPS” metric. Presently, a few other REITs also have no consensus estimate.
Second Note: Due to the way historical amortized cost and hedging is factored into the earnings metrics, it is possible for two mortgage REITs with similar portfolios to post materially different metrics for earnings. I would be very cautious about putting much emphasis on the consensus analyst estimate (which is used to determine the earnings yield). In particular, throughout late 2022 the earnings metric became less comparable for many REITs.
Residential Mortgage REIT Charts
 The REIT Forum |
 The REIT Forum |
 The REIT Forum |
Commercial Mortgage REIT Charts
 The REIT Forum |
 The REIT Forum |
 The REIT Forum |
BDC Charts
 The REIT Forum |
 The REIT Forum |
 The REIT Forum |
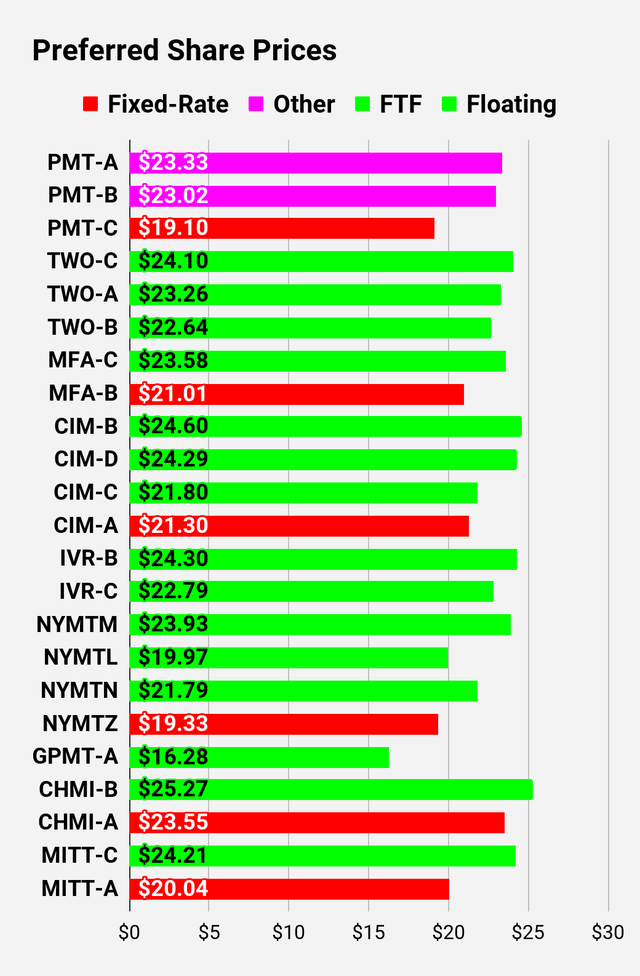
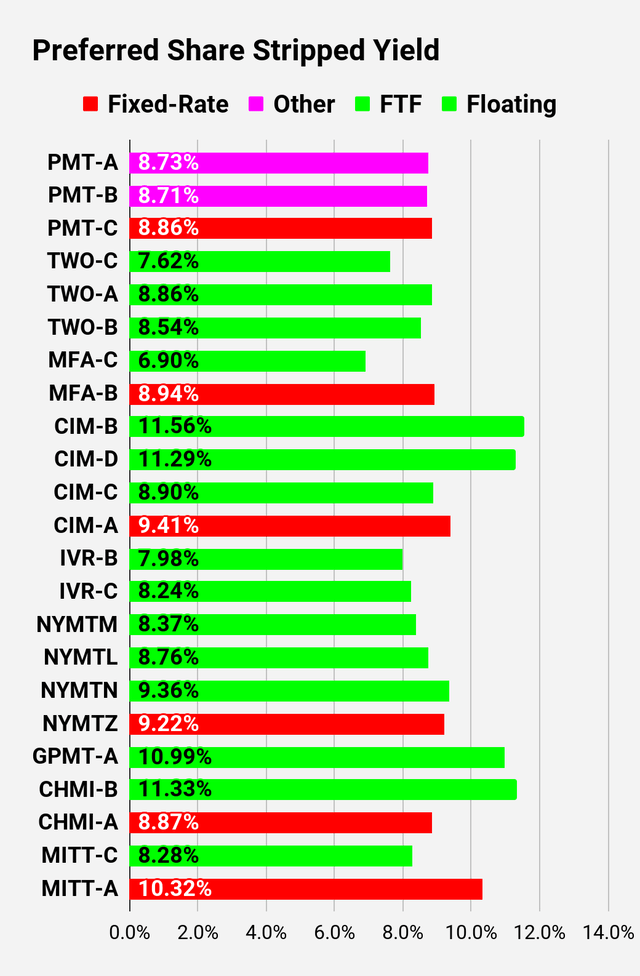
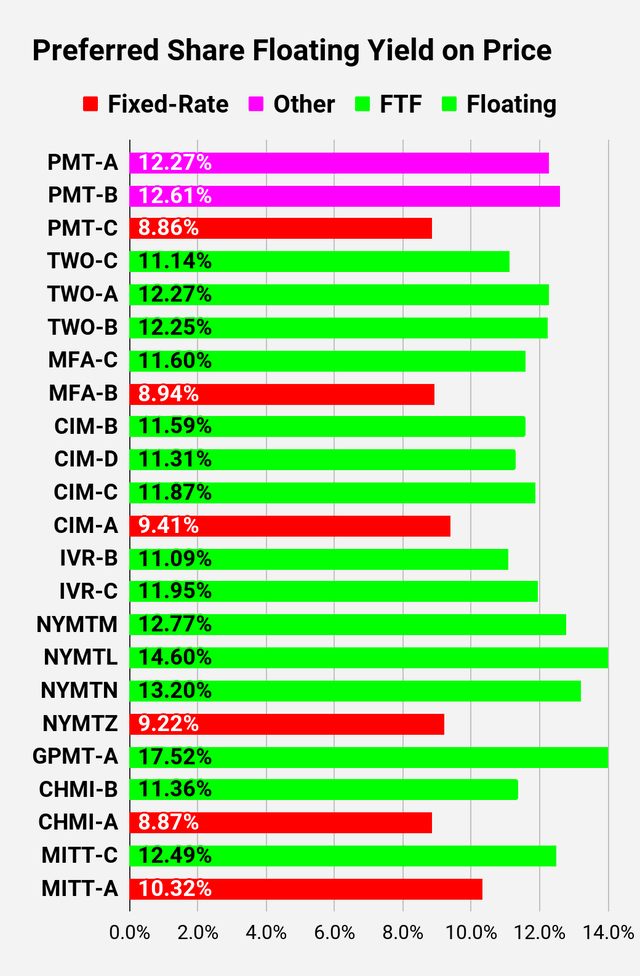
Preferred Share and Baby Bond Charts
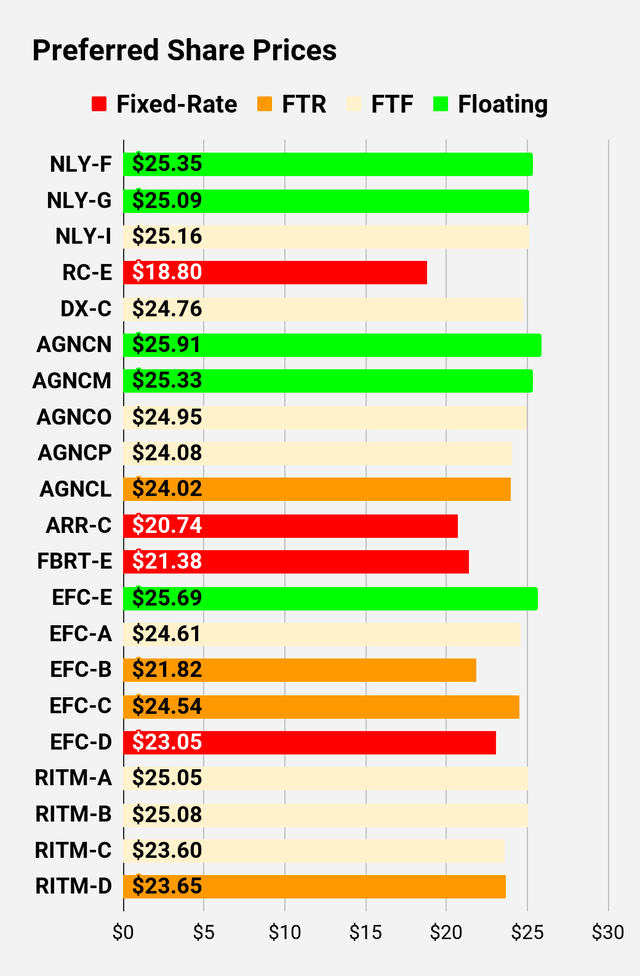
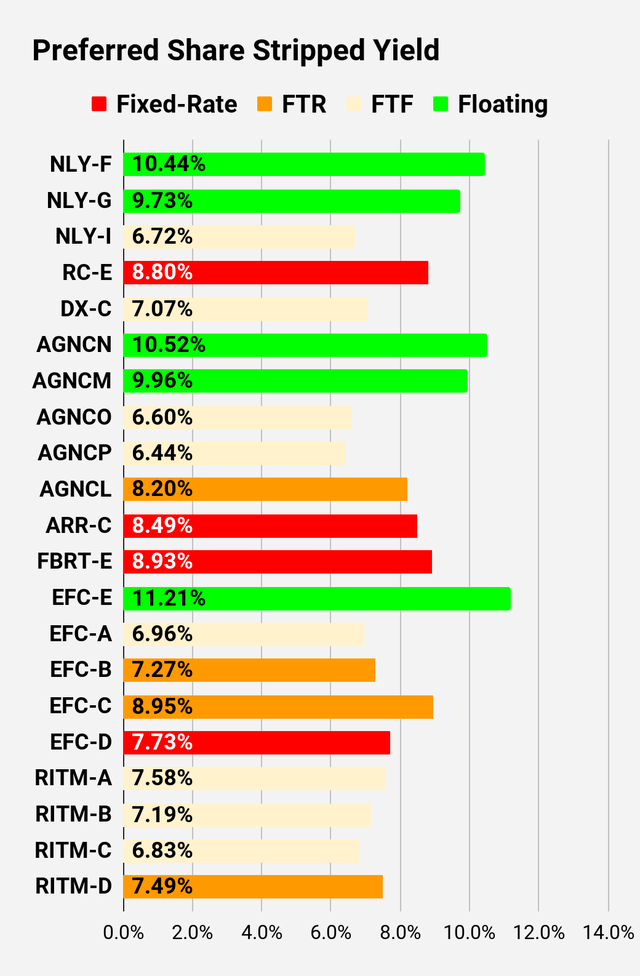
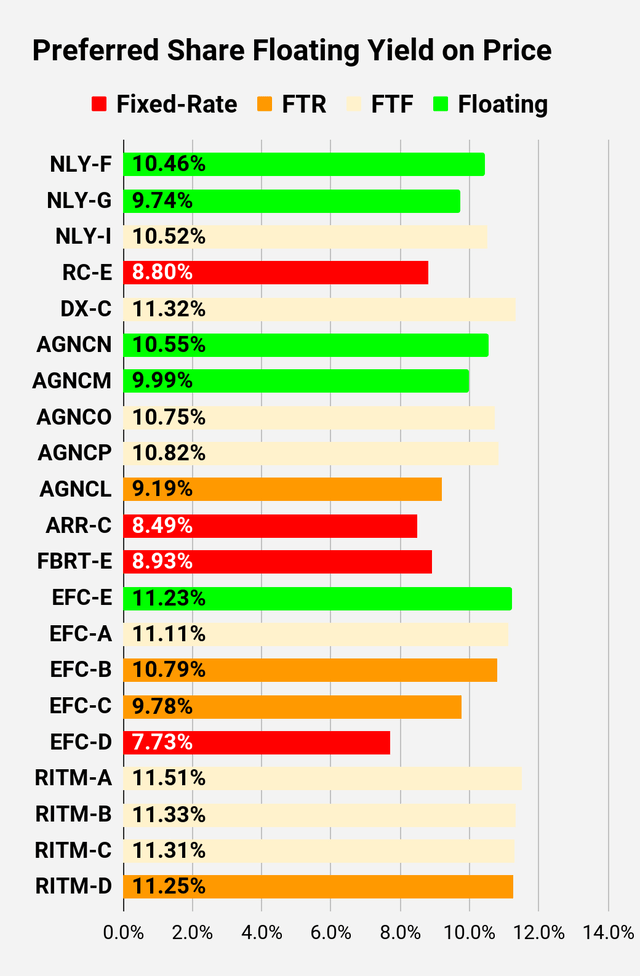
I changed the coloring a bit. We needed to adjust to include that the first fixed-to-floating shares have transitioned over to floating rates. When a share is already floating, the stripped yield may be different from the “Floating Yield on Price” due to changes in interest rates. For instance, NLY-F already has a floating rate. However, the rate is only reset once per 3 months. The stripped yield is calculated using the upcoming projected dividend payment and the “Floating Yield on Price” is based on where the dividend would be if the rate reset today. In my opinion, for these shares the “Floating Yield on Price” is clearly the more important metric.
 The REIT Forum |
 The REIT Forum |
 The REIT Forum |
 The REIT Forum |
 The REIT Forum |
 The REIT Forum |
 The REIT Forum |
 The REIT Forum |
 The REIT Forum |
Note: Shares that are classified as “Other” are not necessarily the same. Within The REIT Forum, we provide further distinction. For the purpose of these charts, I lumped all of them together as “Other”. Now there are only two left, PMT-A and PMT-B. Those both have the same issue. Management claims the shares will be fixed-rate, even though the prospectus says they should be fixed-to-floating.
Preferred Share Data
Beyond the charts, we’re also providing our readers with access to several other metrics for the preferred shares.
After testing out a series on preferred shares, we decided to try merging it into the series on common shares. After all, we are still talking about positions in mortgage REITs. We don’t have any desire to cover preferred shares without cumulative dividends, so any preferred shares you see in our column will have cumulative dividends. You can verify that by using Quantum Online. We’ve included the links in the table below.
To better organize the table, we needed to abbreviate column names as follows:
- Price = Recent Share Price – Shown in Charts
- S-Yield = Stripped Yield – Shown in Charts
- Coupon = Initial Fixed-Rate Coupon
- FYoP = Floating Yield on Price – Shown in Charts
- NCD = Next Call Date (the soonest shares could be called)
- Note: For all FTF issues, the floating rate would start on NCD.
- WCC = Worst Cash to Call (lowest net cash return possible from a call)
- QO Link = Link to Quantum Online Page
Second batch:
Third batch:
Strategy
Our goal is to maximize total returns. We achieve those most effectively by including “trading” strategies. We regularly trade positions in the mortgage REIT common shares and BDCs because:
- Prices are inefficient.
- Long-term, share prices generally revolve around book value.
- Short-term, price-to-book ratios can deviate materially.
- Book value isn’t the only step in analysis, but it is the cornerstone.
We also allocate to preferred shares and equity REITs. We encourage buy-and-hold investors to consider using more preferred shares and equity REITs.
Read the full article here