


Stocks soared yesterday with the S&P 500 set to breakout above the 4,200 level today. Investors were encouraged by comments from House Speaker Kevin McCarthy, who said that a deal on the debt ceiling is within reach this week, which could put it to a vote next week. Earnings reports also lifted sentiment with better-than-expected results from WalMart.
Finviz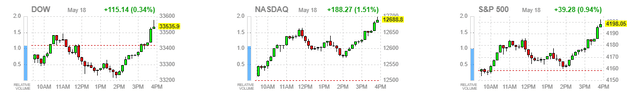
I have been steadfast in my outlook for a soft landing and bull market since the beginning of this year based on improving rates of change in the economic and market fundamentals. Numerous technical indicators, which I have noted along the way, have emboldened my fundamental outlook. The most bullish technical indicator of them all was triggered on January 12, and today’s report is an update on where that indicator stands. As a preview, it continues to shine extremely bright for the remainder of 2023.
As of late, the bears have pointed to the narrowing breadth for the S&P 500, as the index grinds higher. That is visible in a chart comparing the market-cap weighted S&P 500 index (black line) with its equal-weight index (blue line). The equal-weight index has risen less than 2% compared to almost 10% for the market-cap weight. The divergence started in March and has continued to today.
Stockcharts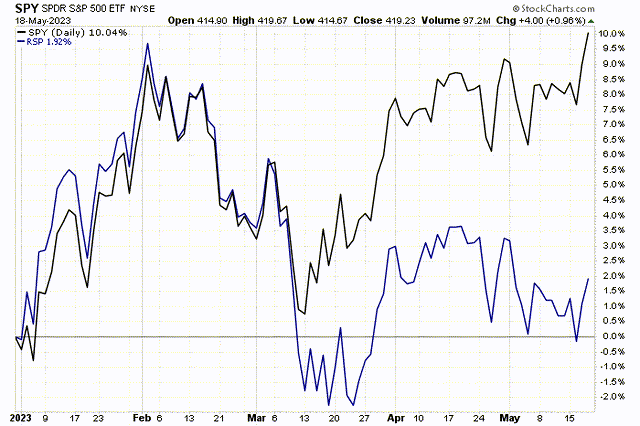
While it is true that a half dozen of the largest mega-cap technology names are responsible for most of this year’s index gains, I have countered that these names were playing catch up with the rest of the index constituents when they trailed in February. In fact, the two versions of the index have traded leadership back and forth since the October bear-market bottom. I expect breadth to improve during the second half of this year, as the largest technology names are in overbought territory and due for a pause.
Stockcharts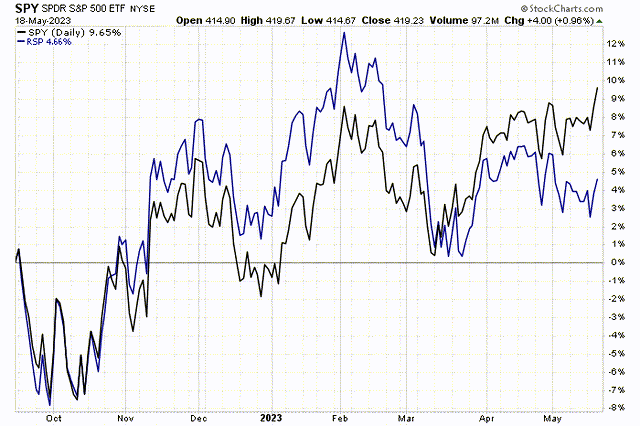
Improving breadth is the focus of the technical indicator I am reviewing today. On January 12, a Breakaway Momentum buy signal was triggered, which is an indicator crafted by esteemed technician Walter Deemer. It is rare, because it requires the ratio of advancing to declining stocks on the NYSE to exceed 1.97 over a ten-day period. It has only happened 24 times since 1945, and it was triggered for a 25th time in January when the S&P 500 closed at 3,898. The forward returns for the S&P 500 have been higher 96% of the time in the 6- and 12-month periods after the buy signal was triggered.
TheStreet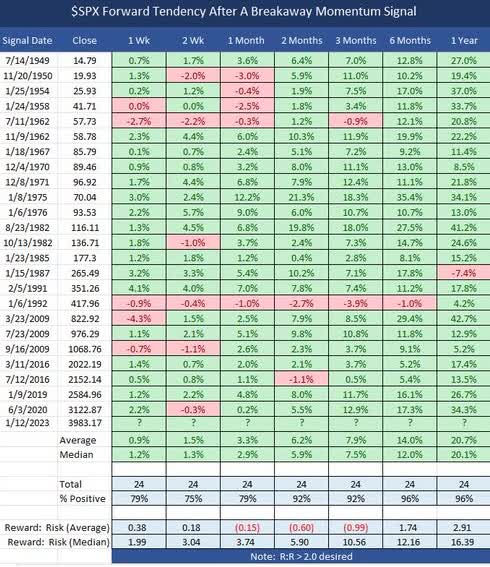
I noted last month that we saw positive returns for the one-week, two-week, one-month and three-month periods that followed the trigger. Only the two-month period fell short with a modest loss of 1.63%.
At the same time that Walter Deemer’s Breakaway Momentum buy signal was triggered, two additional market breadth buy signals were triggered, using different methodologies, which further increases the historical probabilities for positive forward returns. Wayne Whaley’s Advance Decline Thrust indicator and the Triple 70 thrust signal from Quantifiable Edges both gave rare buy signals. The data below shows the seven times that two of these three indicators were triggered going back to 1957, and the forward returns are astounding. (I apologize for the small print.) The S&P 500 posted positive returns 100% of the time during 10 different time frames ranging from 63 to 252 days.
QuantifiableEdges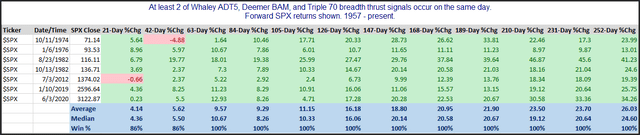
For the first time, all three of these breadth indicators have triggered buy signals. While we did see a negative return for the S&P 500 two months after all three were triggered, that did occur during one of the previous seven periods, but the returns have been positive for the three and four month periods that followed, as they were in all seven prior instances. As the data shows, returns have been positive 100% of the time every month that follows for the 12-month period, which would run us through the end of 2023.
Granted, anything can happen in the market, and I would never rely solely on one indicator to formulate my outlook. That said, an indicator like this one that is rarely triggered and has an extremely accurate track record gives me a lot more confidence in my outlook for a continuation of the economic expansion and new bull market in 2023.
Read the full article here