

In one of the more bizarre intraday price moves we’ve seen in the crypto market in a while, it was the stairs up and the elevator down for Bitcoin (BTC-USD) on Wednesday. Bulls and bears both took it on the chin at various points during the session. First, bulls pushed the price up to $30,000 from a Tuesday close of $28,300.
BTC 1hr Chart (TradingView)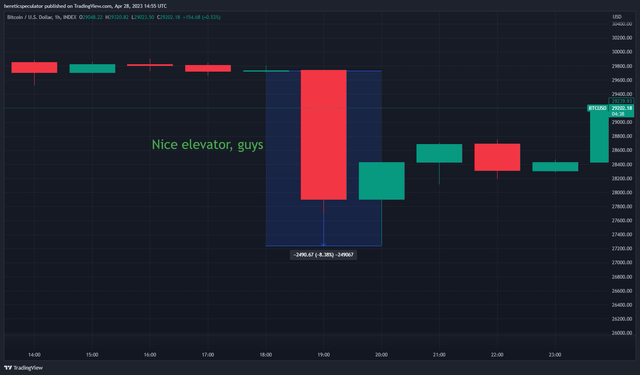
Then late in the Wednesday session BTC’s dollar price crashed more than 8% in about a 90 minute timeframe from $29,700 down to $27,200 before somewhat amusingly closing the Wednesday session back at $28,400. In the process, more than $2.5 billion in open interest was wiped out during that single elevator candle.
What Caused That?
There was quite a bit of speculation that the dump was caused by a rumor-related panic sell following a $26.6 million BTC deposit to Binance by market maker Jump Trading. This deposit was alerted via Twitter by chain analysis company Arkham Intelligence and was in close proximity to a false alert that the US Federal Government was actively selling seized BTC holdings from the Silk Road confiscations. That alert was attributed to Arkham.
US Gov BTC Holdings (Dune Analytics/21Shares)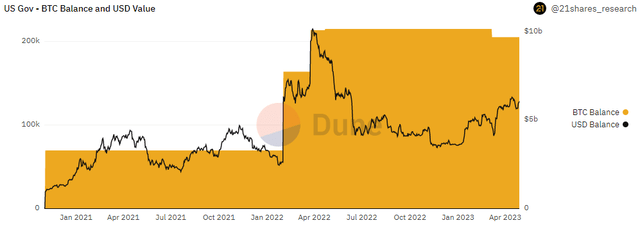
That turned out to not be true as the US Government’s balance is still well over 205k BTC and hasn’t budged since early March. Arkham’s explanation online was that the alert did indeed happen but that it was improperly configured at the user end by a well-followed crypto news account on Twitter. The account then shared that incorrect information online.
Onlookers falsely attributed the decline in BTC’s price to Jump Trading reacting to the Arkham Silk Road funds alert, when it in actuality Jump’s deposit was an hour earlier. The end result was a very volatile Wednesday session that closed roughly breakeven, but not before traders lost billions in the process.
Network Metrics
As far as the actual activity on the network is concerned, Bitcoin’s usage has remained stable in recent weeks and we’re seeing that activity reflected through a generally positive trend in daily active users:
Active Addresses (Messari)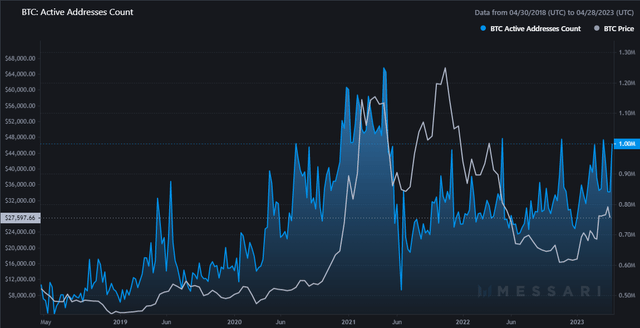
DAUs on the main layer have oscillated between 800k and 1 million over the last several weeks. Raw transaction figures have increased in recent days according to data from IntoTheBlock. However, despite the increase in total transactions, the BTC volume of the transactions has remained low compared to 2022 levels.
BTC Transaction Volume (IntoTheBlock)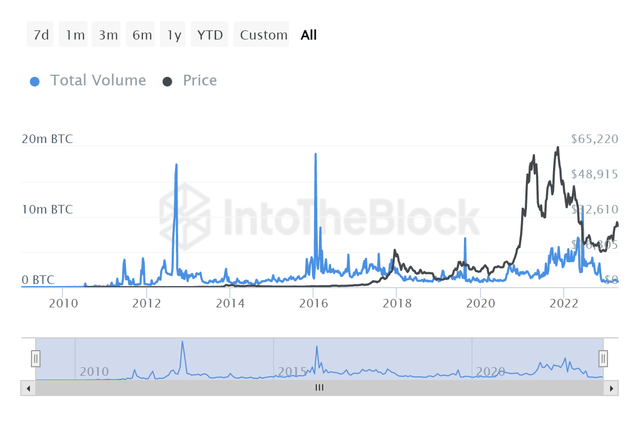
After cooling off for much of April, there has been a noticeable jump in daily fees over the last couple of days:
BTC Daily Fees (Token Terminal)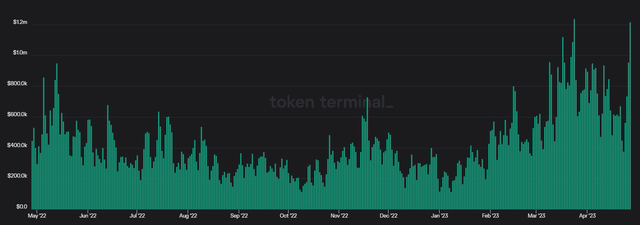
In my opinion, this is likely attributable to another increase in Ordinals mints. Adoption of Bitcoin’s controversial NFT project Ordinals continues to make new daily inscription highs. There have now been over 2 million NFTs minted with Bitcoin’s block space since that project launched a few months ago.
Ordinals Daily Mints (Dune Analytics/dgtl_assets)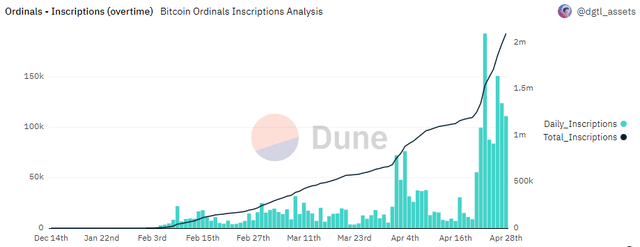
However, what’s been different about this recent surge higher in Ordinals mints has been the lack of a surge in transaction fees up until the last couple of days.
Ordinals Fees (Dune Analytics/dgtl_assets)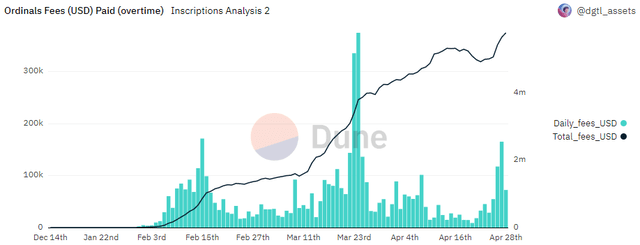
We can see from the chart above that daily fees paid to inscribe Ordinals fell from a peak of $375k on March 24th down to just $8.8k on April 20th. This recent pop in daily inscriptions has resulted in more fee revenue than was apparent during the early April inscription highs.
Other Considerations
Another important metric to consider when guessing where the BTC price is going in the short to medium term is exchange flows. Typically when exchange flow is net negative, it means buyers are accumulating and taking assets into self-custody. Conversely, when exchange net flow is positive, it could be a sign that holders are looking to take profit.
Exchange Net Flows 1 Month (IntoTheBlock)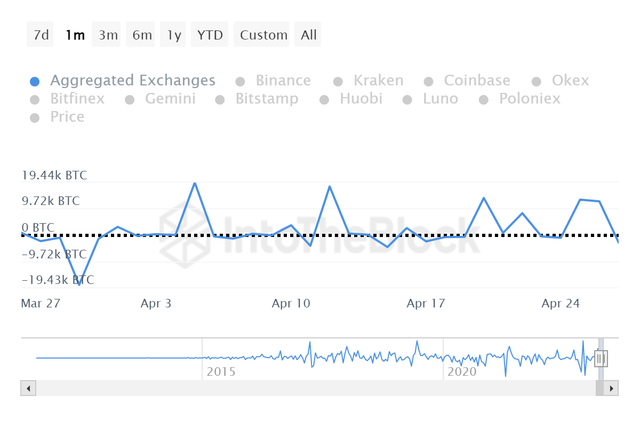
According to data provided by IntoTheBlock, aggregated exchange flows have been positive by nearly 76k BTC since the start of April. That represents $2.2 billion in positive net flow over the last 27 days. I’d call that a fairly bearish development for the short term.
90 Day NVT (CoinMetrics)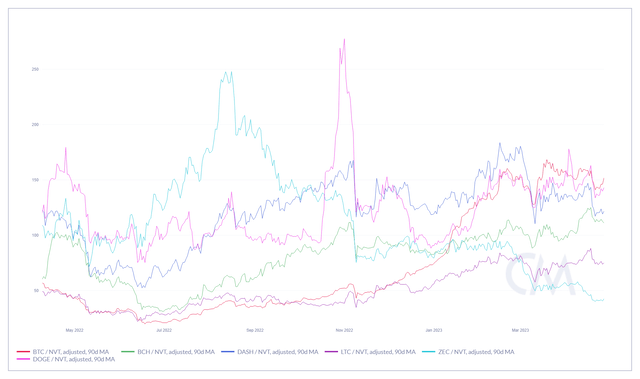
Something else that I often point to when I look at these more payment-focused cryptocurrencies is the NVT ratio. The NVT utilizes the USD value of the transaction volume and the market capitalization of each cryptocurrency to try to determine when a coin is moving more based on speculation rather than when it is moving because of an increase in value being transacted. The higher the NVT, the more overvalued the coin theoretically is.
The day to day variance of this metric can be very volatile so to smooth it out I like looking at the 90 day adjustment. Bitcoin’s 90 day NVT ratio is still above 150. It’s gone from the cheapest PoW coin by NVT last summer to the most expensive one now. There is no standard rule for what a low NVT is or what a high NVT is. Personally, I think 150 is high. I take that view because before February of this year, the last time BTC was above 150 on a 90 day adjusted NVT was in November 2013.
Summary
There are many lessons that crypto participants can take from the Jump/Arkham confusion. From where I sit, the most important one is to watch the chains, not the Twitter feed. I would also be very cautious when using leverage in these assets. Market participants who buy and hold with confidence didn’t get wiped out on Wednesday. It was the day traders and margin bettors who did.
Block Reward vs Price (LookIntoBitcoin)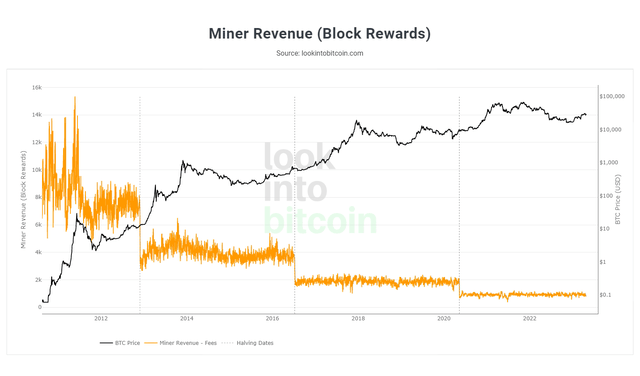
There is a Bitcoin halving a year away. If history rhymes, BTC’s dollar denominated price will be much higher in 18 to 24 months than it is now. Dollar cost average holders who don’t play the margin game will likely do very well post-halving. At this point, the last thing a Bitcoin bull should want is to get wiped out through leverage before the next cycle starts. Risks certainly remain and there is no guarantee that BTC will continue to behave the same way it has behaved following previous halving events.
When assessing everything that I’m seeing on chain, I would probably be cautious rather than aggressive at this point. It is very possible we see a higher BTC price in the weeks and months ahead. There are positive signs from a usage and a holder growth standpoint. However, I believe in the shorter term, bulls who want to aggressively scale a position rather than dollar cost average over time can probably be patient and wait for a better price.
Read the full article here