Investment Thesis
Investing in ProShares Ultra Bloomberg Natural Gas ETF (NYSEARCA:BOIL) can be a good way for daily traders to make money when natural gas prices are going up. It is designed to deliver double the daily return of natural gas prices, so when gas futures go up, BOIL can offer significant profits. The ticker also allows day traders to gain exposure to the natural gas market without dealing with complicated future contracts. From a trade execution perspective, it’s like buying shares of a company, so it’s much simpler and easier to trade.
However, BOIL also comes with substantial risks. It’s not a good choice for long-term investing because it’s built to follow the natural gas market daily. Over time, the effects of leverage, compounding, and daily rebalancing can result in the ETF’s performance diverging from the actual trajectory of natural gas prices.
For instance, a rise in gas prices over an extended period doesn’t necessarily guarantee that BOIL shareholders will enjoy capital gains. The structure of this ETF means that the pattern of price appreciation – the pace and scale of daily shifts and the shape of the upward trend has a significant impact on determining BOIL’s performance. Additionally, even in a situation where gas prices remain flat, BOIL is likely to experience a decay effect, which could diminish returns over time. Consider this hypothetical scenario. Suppose the natural gas index that BOIL tracks is at $100, and BOIL trades at $100. Let’s say the index rises 10% to $110, and subsequently, BOIL (with its 2x leverage factor) rises 20% to $120. The next day, the index dives down by 9% to its original level of $100. Subsequently, BOIL will go down 18% to $98.4, a 1.8% loss despite the underlying index tracked by BOIL has experienced no change. Repeat this enough times, and the losses can be substantial.
So, while daily increases in gas prices can lead to daily profits for BOIL investors, those same investors could suffer losses over longer periods, even if gas prices are trending upwards or remain flat. These dynamics, combined with the complexity of factors impacting natural gas prices, render BOIL one of the riskiest ETFs on the market today, underpinning my sell rating.
The Fundamentals in Simple Terms
BOIL is an exchange-traded fund “ETF” that aims to provide investors with leveraged daily exposure to the performance of natural gas prices. It does this by tracking the Bloomberg Natural Gas Subindex, which is an index that follows the performance of a set of natural gas futures contracts traded on the Henry Hub, an oil and gas port in Louisiana. Bloomberg uses future prices collected by the CME Group at the hub to maintain its index. Bloomberg Natural Gas Subindex primarily consists of short-term Henry Hub Natural Gas futures.
The hub is a significant distribution center for natural gas in the United States, connecting various pipelines that transport natural gas across the country and is also used for future physical delivery points, in addition to being a pricing benchmark.
Since the Bloomberg Natural Gas Subindex primarily tracks Henry Hub Natural Gas futures, the index, and the BOIL ETF are more reflective of natural gas prices in North America. This is because the Henry Hub pricing benchmark is specific to the United States and is influenced by factors such as regional supply and demand dynamics, transportation costs, and storage levels.
Although the oil and gas trade is connected worldwide, it’s important to realize that, in the last few months, prices in different regions have varied significantly due to geopolitical dynamics causing imbalances in natural gas availability in different regions. For this reason, when we look at how the underlying assets of BOIL are performing, we should focus on the US natural gas market.
Supply and Demand
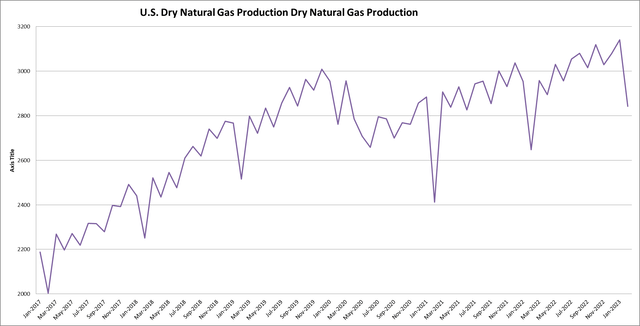
US dry natural gas production has been on a steady rise, notwithstanding typical seasonal fluctuations and disruptions due to the COVID pandemic. According to the Energy Information Administration “EIA”, January saw a record output of 3142 billion cubic feet “bcf” of dry natural gas. Although the production dipped to 2842 bcf in February, this figure is still higher than the output in the same month of previous years. The drop also aligns with historical patterns. The increase is attributed to technological advancements in hydraulic fracturing and horizontal drilling technologies, which have made it economical to extract natural gas from shale formations.
EIA
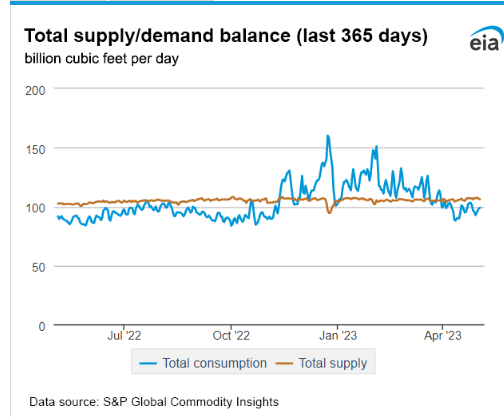
Natural gas consumption also follows seasonal patterns, with increased demand in winter months, underscoring the role of the commodity in heating American homes. In Spring, demand ebbs, followed by a small uptick in the summer as demand for electricity for air conditioning increases. Data from the most recent months available in the EIA monthly report show consistent patterns. However, unlike production, which saw a YoY increase, consumption declined by 3.3%, standing at 2959 bcf in 2022, compared to 3061 bcf in 2021. The decline in consumption is likely due to slowing manufacturing and industrial demand. Data from the EIA show that gas consumption for heating purposes increased to a record high this winter season (November 2022 – March 2023). Still, the imbalance is still evident, as shown in the graph below.
S&P Global via EIA
The nation’s extra capacity is currently exported. To my knowledge, the US became a net exporter of natural gas in 2017, thanks to the shale oil and gas boom and the development of liquified natural gas “LNG” facilities which enabled the US to export natural gas to the global market.
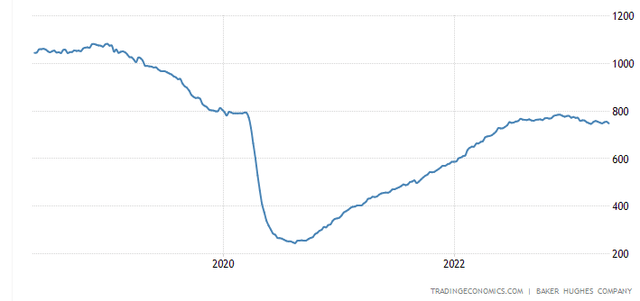
Moreover, TTM figures also show that after two years of Natural Gas storage withdraws, the US is building its inventory again, but the progress is not linear, with monthly variations.
Baker Hughes via Trading Economics
Summary
BOIL offers a speculative day-trading tool for traders looking to amplify returns from daily movement in natural gas prices in the US. The ETF’s structure and inherent risks, including the effects of leverage and daily rebalancing, make it unsuitable for long-term investing. BOIL’s performance will likely diverge from the actual trajectory of natural gas prices over time, potentially leading to losses even if gas prices trend upwards or remain flat.
The ETF reflects the performance of the Bloomberg Natural Gas Subindex, which primarily tracks a set of short-term Henry Hub Natural Gas futures. The US has seen a consistent rise in natural gas production and has become a major exporter of the energy commodity. However, consumption in the US has shown a year-over-year decline, leading to a supply-demand imbalance. Traders might want to closely monitor the May 31st EIA monthly report data, which will cover supply, demand, and export data for the March and April months, which brings us to a final point; trading in commodities is very risky, and data is often lagging in nature. Until a live stream of economic indicators is available, I don’t believe that trading BOIL is anything but a speculative endeavor.
Read the full article here


