


The World’s Most Important ETF
The weekly chart of the SPDR S&P 500 ETF (NYSEARCA:SPY) contains numerous forms of improvement which tell us to be open to more upside in the coming weeks and months.
When weekly MACD dropped below zero in 2022 (highlighted in orange), it was indicative of a significant shift in weekly momentum. In the first half of 2023, weekly MACD recaptured the zero line, telling us the odds were favorable the weekly downtrend in 2022 was giving way to a new uptrend. The August 2023 bearish MACD cross (highlighted in yellow) occurred above the zero line, which aligns with a countertrend move (correction) within the context of an existing uptrend. The market is trying to give more weight to that thesis as it attempts to shift back to the primary uptrend (bullish MACD cross above zero). The weekly MACD cross that was in place during Wednesday’s session needs to carry into Friday’s close, something that currently falls into the to be determined category.
CCM/stockcharts.com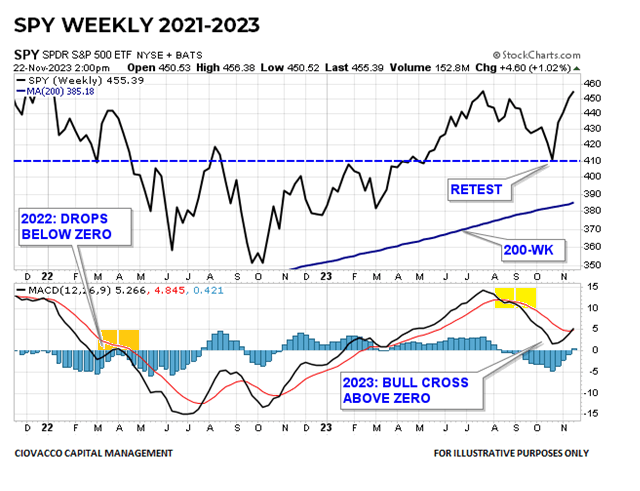
NASDAQ 100 – QQQ
Both SPY and the Invesco Nasdaq 100 Trust (QQQ) made stands in 2022 near an upward-sloping 200-week moving average, which provided evidence of a secular trend in stocks that remains in play today.
CCM/stockcharts.com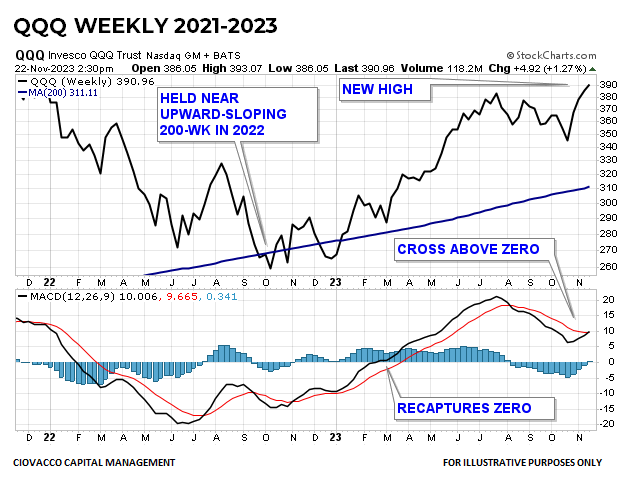
Technology Sector
We can add the SPDR Technology Sector ETF (XLK) to the list of charts with improving weekly momentum. It is noteworthy that three of the most significant equity ETFs (SPY, QQQ, and XLK) are telling us to be open to a resumption of the weekly uptrend that was established earlier in 2023.
CCM/stockcharts.com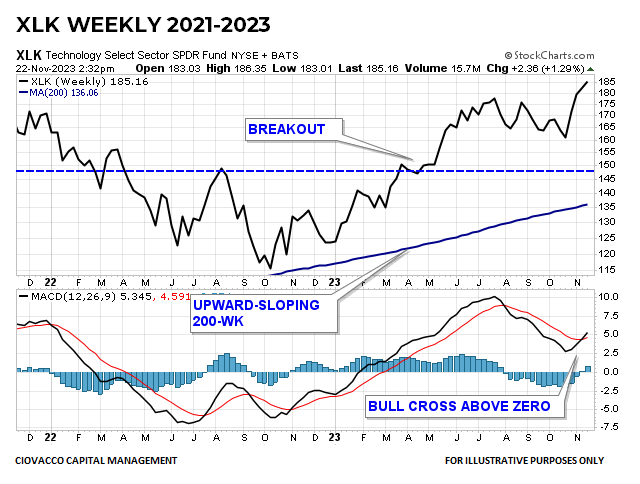
1500 > 500
Staying with the broad participation theme, the SPDR S&P 1500 Composite ETF (SPTM) is also showing signs of what could be a sustainable rally. SPTM broke out from a multi-month base in May. The recent correction now looks like a successful retest of the base, with SPTM holding near a logical area.
CCM/stockcharts.com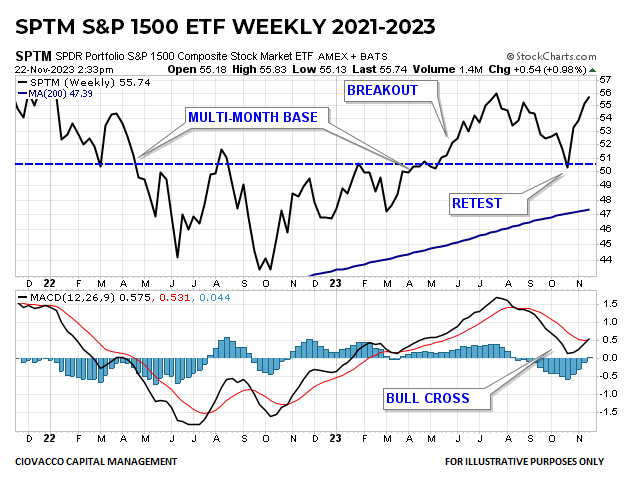
Dow Wakes Up
The SPDR Dow Jones Industrial Average ETF (DIA) recently had a failed bullish breakout look (orange highlighted area). That concerning look morphed back into a retest look with price recapturing the important support/resistance region denoted via the dotted blue line. It is noteworthy the consolidation/confusion that occurred over the past year all took place above an upward-sloping 200-week moving average, which aligns with a demographically-induced secular bull market.
CCM/stockcharts.com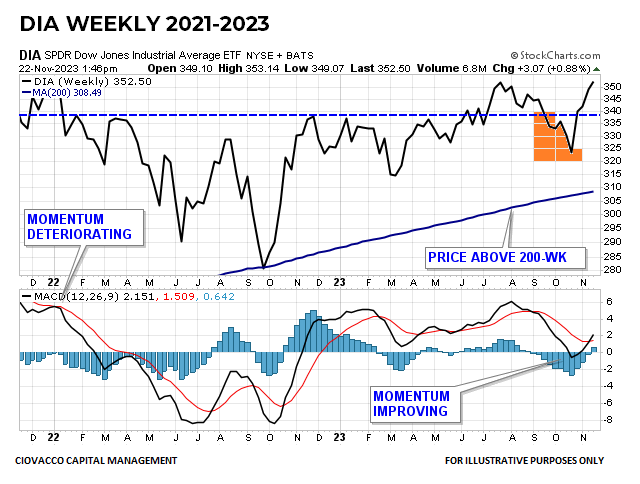
A Now Tepid VIX
During the recent stock market correction, the Volatility Index (VIX) failed to push into the concerning 25-31 region outlined on October 9. Similar to DIA’s false bearish breakdown on the chart above, the VIX gave market participants a head fake when it pushed back into the region that was common in 2022. The push into the low 20s was not sustained with the VIX trading below 13 this week; both developments are favorable for risk assets, including SPY.
CCM/stockcharts.com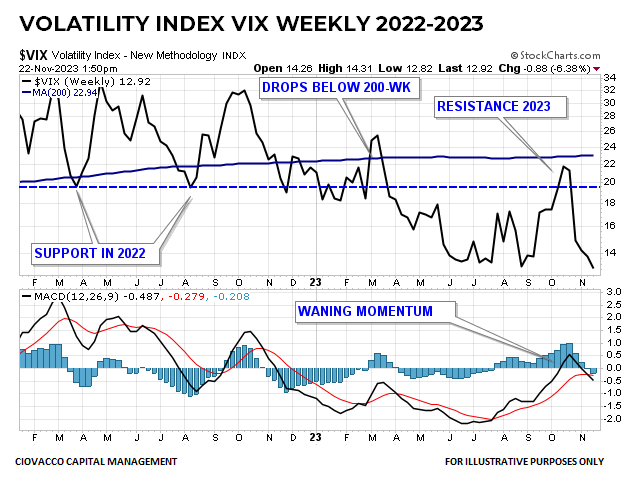
Credit Market
As outlined above, we have hard evidence in hand of a constructive momentum turn on the charts of some of the most liquid equity ETFs, in the context of a VIX that is not putting up much of a fight. Another relevant portion of the weight of the evidence can be found in the credit markets. The weekly chart of the SPDR High Yield Bond ETF (JNK) shares numerous positive developments with the equity ETF charts above. JNK’s attempt to push to a new weekly rally high while recapturing the 200-week moving average speaks to increasing confidence that an alarming wave of bond defaults is not imminent.
CCM/stockcharts.com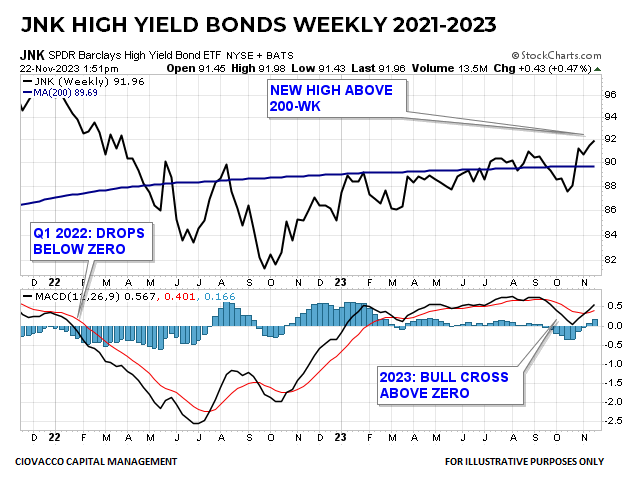
Global Aligns With Broad
Similar to the recent concerning breakdown on the chart of DIA, the Vanguard Total World Stock ETF (VT) recently took on a failed breakout look with price undercutting the Q1 2023 highs. More encouraging was VT’s subsequent stand near an upward-sloping, secular-trend-like, 200-week moving average.
CCM/stockcharts.com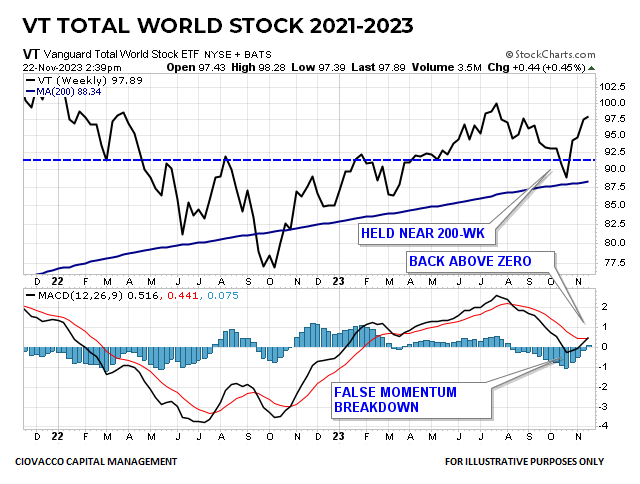
2022 Laggard
Continuing with the broad-based theme, one of the bear market’s lagging sectors, communication services (XLC), has picked itself up off the 2022-mat. The weekly chart below shows an attempt to break to a new multiweek high, increasing the odds the recent stock market correction is in the rearview mirror.
CCM/stockcharts.com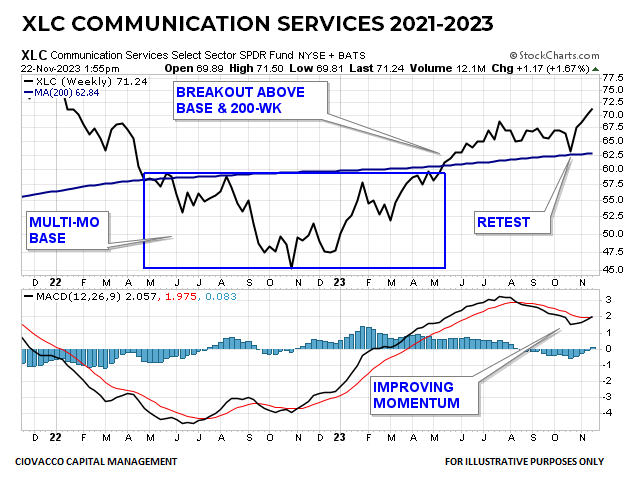
Moral of the Story
Many of the developments described in the charts above need to be nailed down on a weekly closing basis, which means we need to respect the fact that Friday’s holiday-shortened session is still to come. Having said that, the weight of the evidence suggests the weekly uptrends that were established earlier in 2023 experienced a correction and are now in the process of resuming the primary bullish trend. SPY was unable to produce a weekly bullish MACD cross above the centerline in 2022, which means the charts above represent a discernible shift in risk appetite.
Read the full article here