


The May CPI report revealed a 0.1% monthly rise in inflation with a 0.4% increase in the core rate.
On a year-on-year basis, headline inflation verified at 4.0%, a touch lower than economists had predicted, while the core rate rose at a slightly hotter 5.3% annual rate. It was the lowest yearly increase in the headline CPI rate since November 2021.
It was the 11th consecutive month of sequential declines in U.S. inflation – the longest such streak since 1921, according to Bespoke Invest. Egg prices plunged by the most since 1951. Core services ex-housing CPI fell to 4.6% year-on-year – the slowest since February 2022 while three-month annualized CPI now hovers at 5.0%.
U.S. real average weekly earnings fell by 0.7% from a year ago while real average hourly earnings rose 0.2%. After the data hit the tape, odds of a June Fed rate hike dropped to just 5% versus a one-in-four chance seen before the 8:30 a.m. batch of economic figures.
No Big Surprises in May CPI, Slightly Cooler YoY Headline Rate
Bloomberg, Christian Fromhertz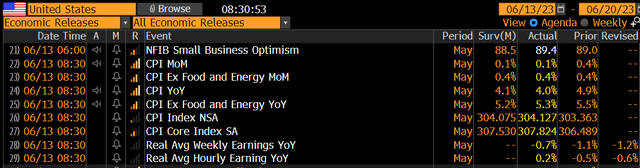
Make it 11 Straight CPI Drops
Trading Economics, Carl Quintanilla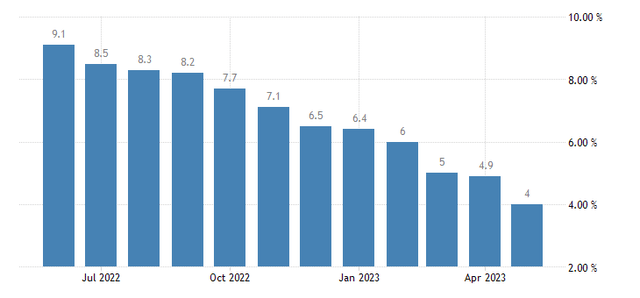
Oil Prices Down Huge YoY, Car Repairs Costly
Liz Ann Sonders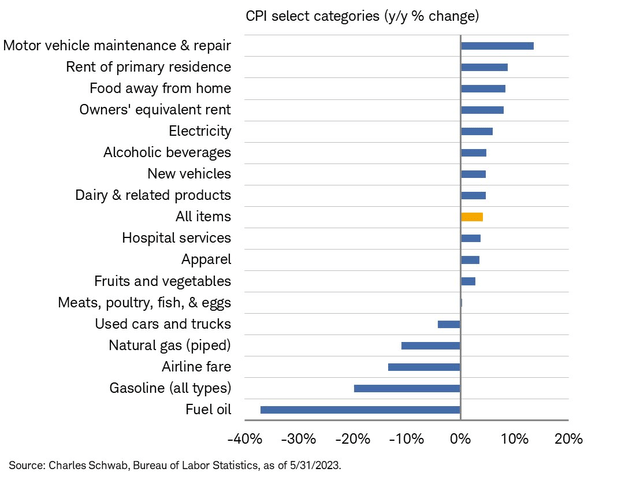
Egg Prices Have Cracked, Down the Most Sequentially Since 1951
Tracy Alloway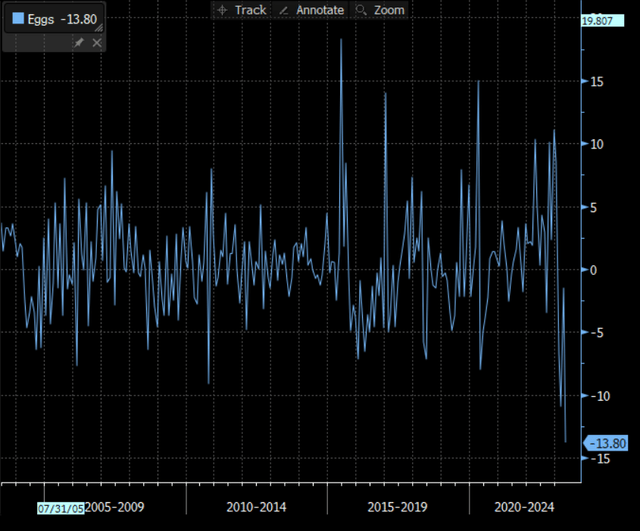
The initial response in the futures market was positive for stocks, bonds, and gold, but bearish for the U.S. Dollar. According to the report, owners’ equivalent rent saw a slight dip last month, falling from an annual rate of 8.1% in April to 8.0%.
Heading into the data dump, JPMorgan put out its usual Game Plan. With the 4.0% CPI rate, the thinking was that the S&P 500 (SP500) would rise by about one percentage point today, though futures currently indicate a more tepid rally. Investors should take the below prognostication with a major grain of salt, in my view.
JPM Expects a Bullish Reaction in Light of In-Line CPI Data
Bloomberg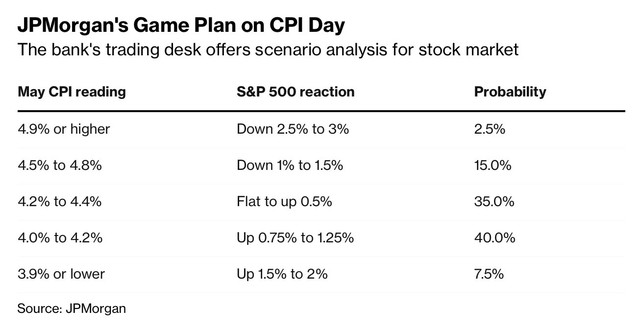
CPI has become much less meaningful. This year’s market reactions have been softer now that investors recognize that consumer price rises are lessening. There appear signs that the Fed may be able to pilot a soft landing, or perhaps no landing at all. Just take a look at two-year inflation expectations. This gauge, released by the New York Federal Reserve on Monday, shows a two-year low in what folks believe inflation will be in the months ahead. That is a helpful sign for the Fed as it begins its two-day meeting today.
Consumers Sanguine on the Inflation Front
Acemaxx, Bloomberg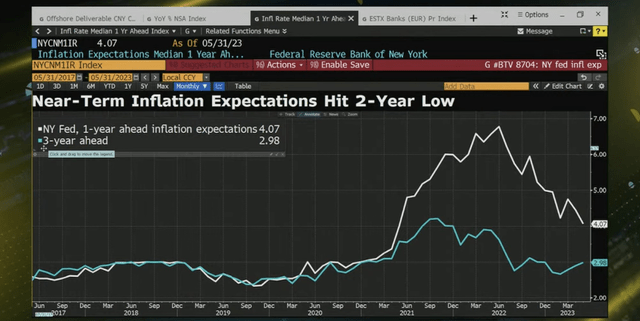
Meanwhile, investors are feeling much more upbeat about markets. After last week’s sudden jump in the AAII Investor Sentiment Survey, the CNN Business Fear & Greed barometer backs up that bullish aura. Now in “extreme greed” territory, the fervor has grown now that the S&P 500 Futures (SPX) is more than 20% off its October 2022 nadir.
Wall Street Turns Greedy
CNN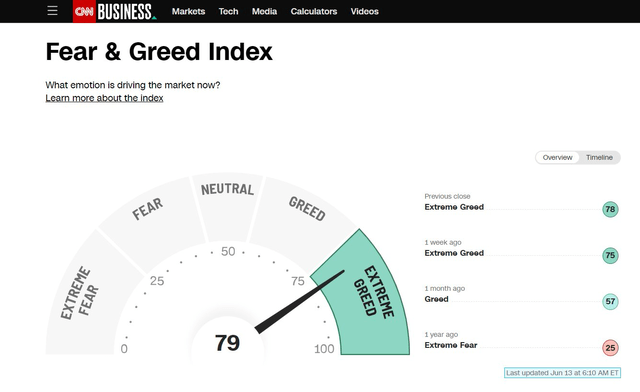
Taking a step back and relating the economic headlines to markets, an easing inflation situation comes as mega-caps continue to reign supreme in 2023. The S&P 500 Total Return Index (SP500TR) is up by about 14% on the year, while the SPX equal-weight measure is barely in the black. Other asset classes, such as commodities, are steeply negative. Bonds, meanwhile, have produced a modest positive return with coupon payments included.
“Mega” Alpha in 2023
Acemaxx, Morgan Stanley, Bloomberg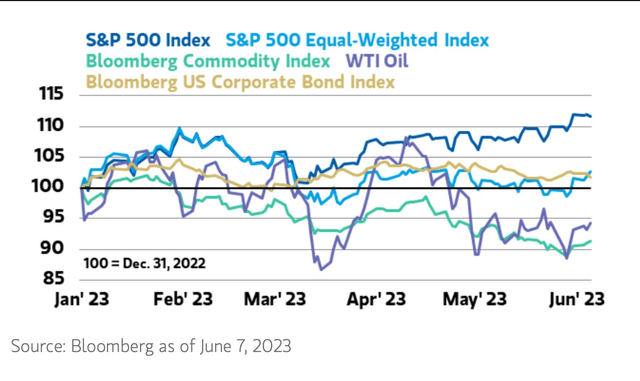
I mentioned earlier that the SPX had notched a 20% rise from the mid-October low touched around the September 2022 CPI report’s release. Data from Ryan Detrick at Carson Group finds that such a rally often begets more bull market action in the months and quarters that follow. That’s a bullish backdrop for the large-cap index.
Equities Rally to a 52-Week High. More Gains on the Horizon?
Ryan Detrick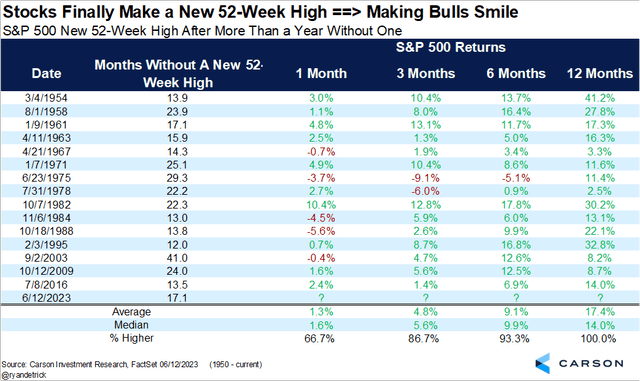
What could be problematic, though, is that the June Bank of America Global Fund Manager Survey, released Tuesday morning this week, shows that the perceived most crowded trade is “long big tech” which commands a major portion of domestic mega-caps.
Too optimistic on Mega-Caps?
Bloomberg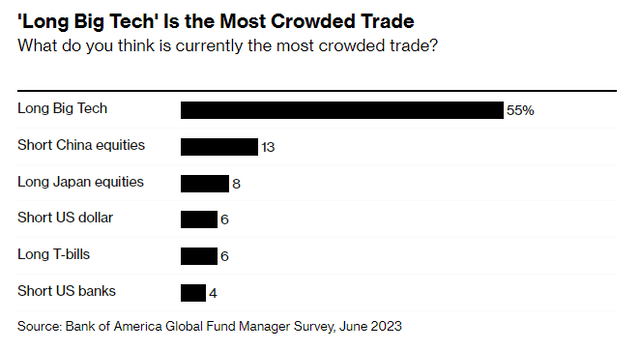
Let’s dig into the Vanguard Mega Cap Index Fund ETF Shares (NYSEARCA:MGC) in light of all these cross currents. According to the issuer, MGC seeks to track the performance of the CRSP US Mega Cap Index while employing a passively managed, full-replication allocation approach. It is a convenient and low-cost product to get some diversification among the biggest U.S. stocks that represent approximately the largest 70% of market cap.
MGC features an annual expense ratio of just 7 basis points and sports a dividend yield of 0.33% over the last 12 months. Tradability is strong with MGC – the 30-day median bid/ask spread is a mere 0.03% while 50-day average volume is only 62,000 shares. MGC houses 231 individual stocks with a median market cap of $233 billion.
The P/E ratio appears high at 22.6, but you must consider that the EPS growth rate is robust at 18.2%, making for a modest forward PEG barely above 1. Therefore, I assert the valuation is reasonable given the growth outlook. The $4 billion fund is about one-third in the Information Technology sector with somewhat modest sector positioning in value and cyclical sectors.
MGC: Sector Breakdown
Vanguard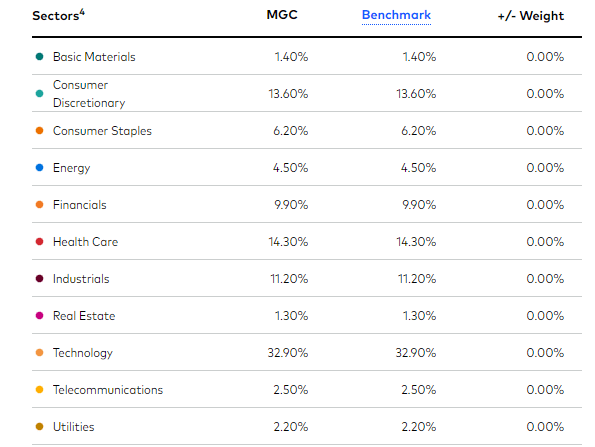
The growth-focused mega-cap niche is composed of highly profitable and quality components with a tilt toward growth, according to Morningstar.
MGC: Portfolio & Factor Profiles
Morningstar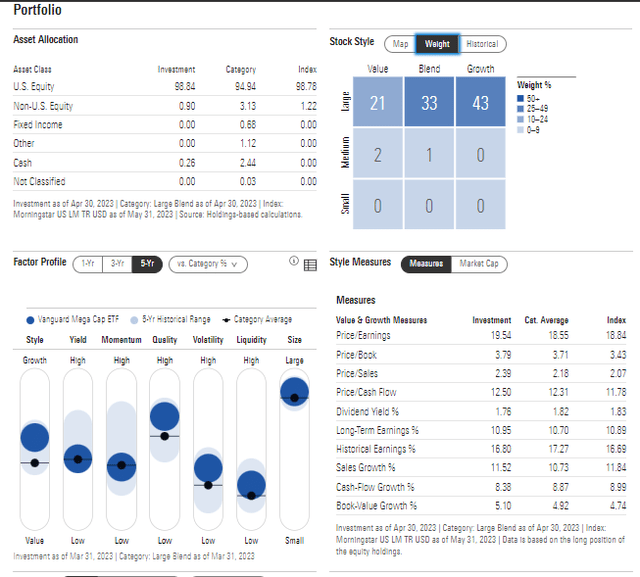
The ETF is a bit concentrated with 32% of assets in the top 10 holdings. As of April 30, 2023, Apple (AAPL) and Microsoft (MSFT) make up more than 16% of MGC.
MGC: Top 10 Holdings
Vanguard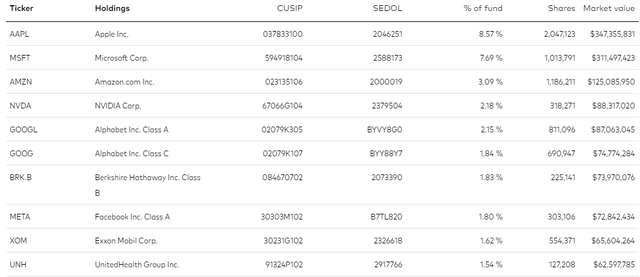
The Technical Take
MGC has completed a bearish to bullish rounded bottom reversal. Notice in the chart below that mega-caps have been on a tear in the last three months after bottoming last October. Momentum is very strong – near 70 on the RSI momentum index at the top of the chart. The ETF is now at 52-week highs, easily above the August 2022 bear market rally peak.
Domestic mega-caps are now within 10% of an all-time high. I see possible resistance at the Q2 2022 high of $163 while support is near $150 (the aforementioned August 2022 zenith as well as a small gap in price just recently at $149). Overall, the trend is higher, further evidenced by a rising 200-day moving average that is above the 50-day.
MGC: Bullish Rounded Bottom, Down Just 10% From the All-Time High
Stockcharts.com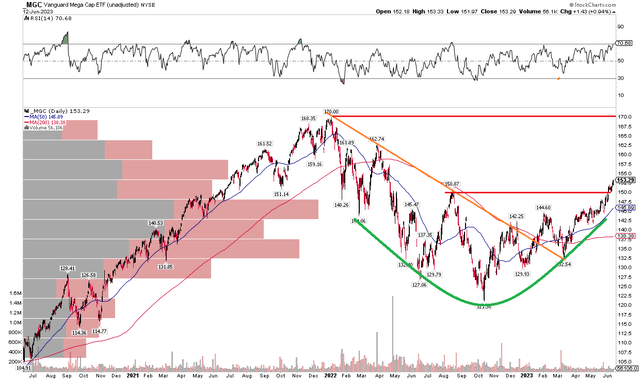
The Bottom Line
Mega-caps are not on the cheap, but with high profitability and a solid EPS growth rate, the low-20s P/E is a reasonable multiple to pay. I have a buy rating on MGC following today’s encouraging CPI data. Vanguard Mega Cap Index Fund ETF Shares boasts a low expense ratio and high liquidity, making it ideal for long-term investors.
Read the full article here