

Introduction
The London-based Endeavour Mining plc (TSX:EDV: CA, LSE: EDV, OTCQX: EDVMF) is one of the largest gold producers in West Africa, with six operating assets across Senegal, Cote d’Ivoire, and Burkina Faso, and a strong portfolio of advanced development projects and exploration assets in the Birimian Greenstone Belt across West Africa.
Endeavour Mining continues its expansion with $22 million spent in 1Q23 out of FY-2023 exploration guidance of $70 million. Also, Endeavour updated the resource for the Tanda-Iguela greenfield discovery expected to be published in H2-2023.
EDVMF Asset Map Presentation (EDVMF Presentation)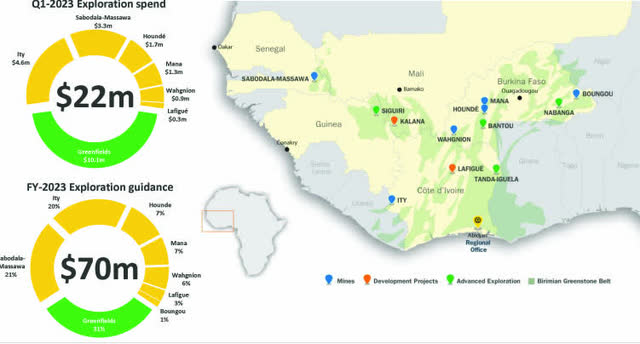
Important note: This article is an update of my article published on March 17, 2023. I have been following EDVMF on Seeking Alpha since 2021.
1 – 1Q23 Results Snapshot
On May 4, 2023, Endeavour Mining announced that gold production for the first quarter of 2023 was 300,838 Au ounces and sold 308,849 Au ounces at an AISC of approximately $1,022/oz.
CEO Sebastien de Montessus said in the press release:
On the operational front, we are tracking in line with our guided trend, as we expect production weighted towards the second half of the year due to mine sequencing across the group. On the growth front, we are pleased to report that the Sabodala-Massawa expansion and the Lafigué greenfield build are progressing well, with both projects on time and on budget with first production expected in Q2 and Q3 2024 respectively. Our goal is to then increase our shareholder returns once these organic growth projects are completed.
Revenues for 1Q23 were $590.6 million, with a net income of $3.8 million. Adjusted earnings were $70 million or $0.28 per share.
EDVMF 1Q23 Highlights (EDVMF Presentation)
Finally, Endeavour Mining is paying a semi-annual dividend of approximately $0.41 per share or a dividend yield of 3.1%.
Sabodala-Massawa expansion and the Lafigué greenfield project are both on budget, with 70% and 46% of the initial capital committed, respectively, and on schedule for Q2-2024 and Q3-2024, respectively.
CEO Sebastien De Montessus said in the conference call:
2023 is an exciting year for Endeavour, and we are pleased to be delivering against our key objectives. Driven by last year’s strong operational performance, we began the year with financial strength, which provides the flexibility to deliver against this year’s capital allocation priority, which is to maintain an attractive shareholder returns program, while unlocking our growth potential. Given that the Sabodala-Massawa expansion and the Lafigue greenfield builds are expected to both increase the Group’s production and lower our cost base, they will further enhance our capability to reward our shareholders.
2 – Investment Thesis
Endeavour Mining plc has an excellent financial profile despite mining exclusively in West Africa, which is not considered a safe jurisdiction compared to North America. Thus, it is always crucial to invest cautiously in those miners who present a riskier business environment.
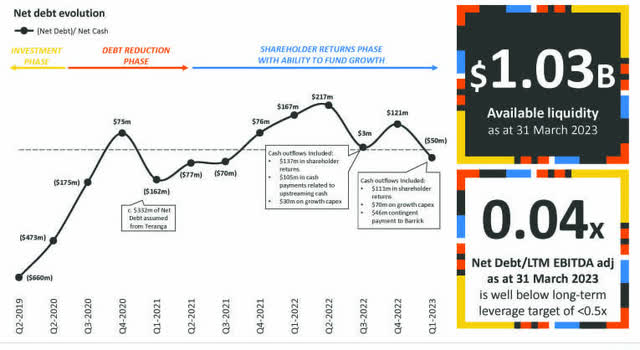
However, the balance sheet looks solid. Endeavour has little net debt and total cash of $813.4 million. Moreover, the company has generated positive free cash flow since 1Q22 and is financing internally new projects (brownfield and greenfield) that will produce in 2024.
Finally, Endeavour Mining is paying a semi-annual dividend of $0.81 per share in 2022 and has an ongoing buyback program with $99 million worth of shares bought in 2022.
EDVMF Dividend History and Buyback Program (EDVMF Presentation)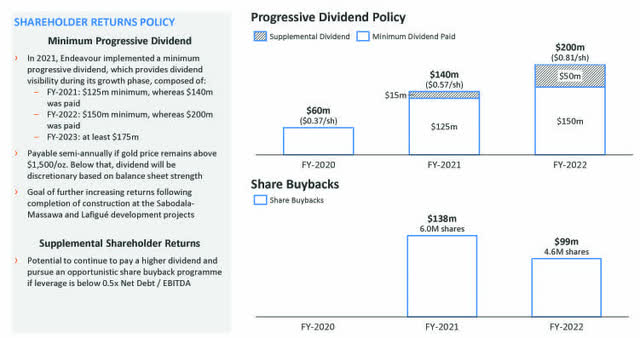
Note: The minimum dividend could be supplemented with additional dividends and buyback, assuming the gold price remains above $1,500 per ounce and net leverage debt to adjusted EBITDA remains below 0.5x.
For investors who want to invest in Endeavour Mining, the main component that should always be carefully analyzed before deciding to place your bet is the price of gold.
The gold price is reaching record levels again, well above $2,000 per ounce. The Fed increased interest rates by 25 points again last week and signaled that it could pause depending on the circumstances. This new strategy is considered favorable for gold bullion, and hopefully, it will support a nice gold miners’ turnaround, which may have started already.
Gold is now up 8% year over year.
EDVMF 1-Year Chart Gold, Silver, Copper (Fun Trading StockCharts)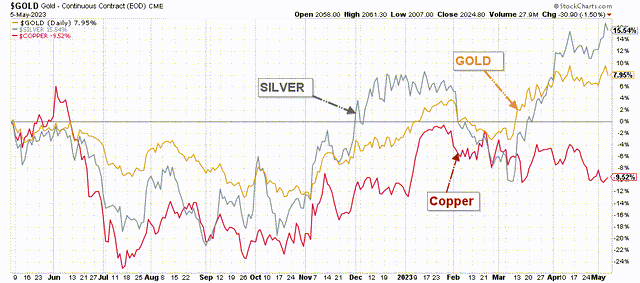
Thus, the best way to profit from such a volatile market is to trade short-term LIFO of 40% of your total position and use your short-term gain to increase your core long-term position for a much higher target.
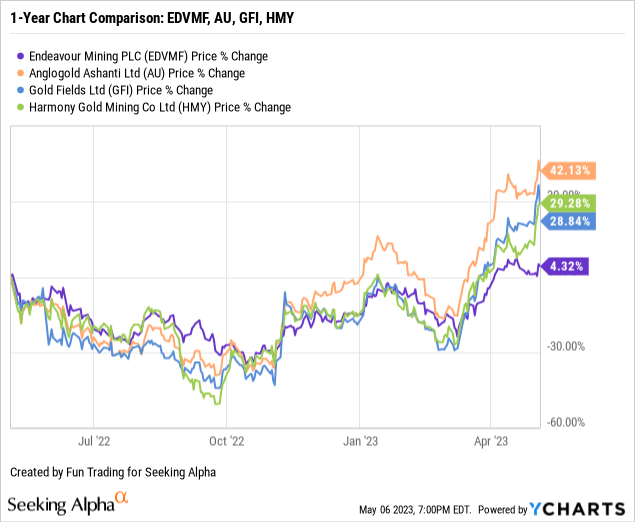
3 – Stock Performance
EDVMF is up 4% on a one-year basis, underperforming the group as shown below:
Endeavour Mining – 1Q23 Balance Sheet And Trend – The Raw Numbers
| Endeavour Mining | 1Q22 | 2Q22 | 3Q22 | 4Q22 | 1Q23 |
| Total Revenues in $ Million | 686.20 | 629.6 | 567.6 | 624.7 | 590.6 |
| Net income attributable to shareholders in $ Million | -42.20 | 189.4 | 57.6 | -262.1 | 3.8 |
| EBITDA $ Million | 215.40 | 414.6 | 299.2 | -107.3 | 203.5 |
| EPS diluted in $/share | -0.17 | 0.76 | 0.23 | -1.06 | 0.02 |
| Operating Cash Flow in $ Million | 304.30 | 253.20 | 153.7 | 310.8 | 205.6 |
| Capital Expenditure in $ Million | 85.20 | 140.30 | 121.4 | 171.4 | 198.5 |
| Free Cash Flow in $ Million | 219.10 | 112.90 | 32.3 | 139.4 | 7.1 |
| Total Cash $ Million | 1,054.30 | 1,109.8 | 888.9 | 962.3 | 813.4 |
| Total Long-term Debt in $ Million | 916.80 | 885.10 | 829.9 | 824.7 | 854.0 |
| Shares outstanding (diluted) in Million | 249.64 | 249.06 | 248.31 | 247.55 | 247.16 |
| Production Au Oz | 1Q22 | 2Q22 | 3Q22 | 4Q22 | 1Q23 |
| Total Production Gold | 367.0 | 345.1 | 342.7 | 355.2 | 300.8 |
| AISC (co-product) from continuing operations | 848 | 954 | 960 | 954 | 1,022 |
| Gold Price realized | 1,911 | 1,832 | 1,737 | 1,758 | 1,886 |
Source: Company releases M&A. Fun Trading files.
Analysis: Revenues, Free Cash Flow, Debt, And Gold Production
1 – Quarterly Revenues for the First Quarter of 2023
EDVMF Quarterly Revenues History (Fun Trading) Revenues were $590.6 million in the first quarter of 2023, down 13.9% from a year ago and down 5.5% sequentially. It was pretty disappointing with weak gold production this quarter. The company indicated that production is weighted towards H2-2023 primarily due to lower production at Boungou, Houndé, and Sabodala-Massawa, partially offset by higher production at Ity and Wahgnion. The net income attributable to shareholders was $3.8 million or $0.02 per diluted share in 1Q23, compared to a net loss of $42.2 million or $0.17 per diluted share in 1Q22.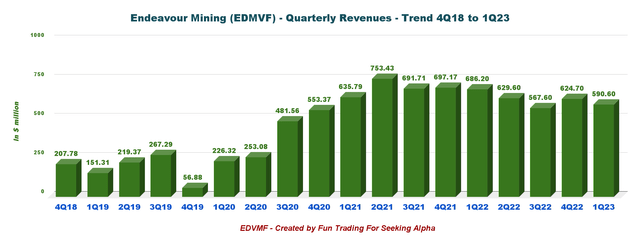
2 – Quarterly Free Cash Flow History
EDVMF Quarterly Free Cash Flow History (Fun Trading)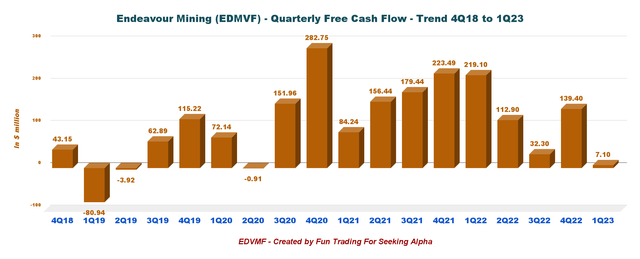
Note: Free cash flow is the Cash from operations minus CapEx.
The company’s free cash flow for the first quarter was $7.1 million, and the trailing 12-month free cash flow was $291.7 million.
3 – Debt Situation in 1Q23
EDVMF Quarterly Cash versus Debt History (Fun Trading)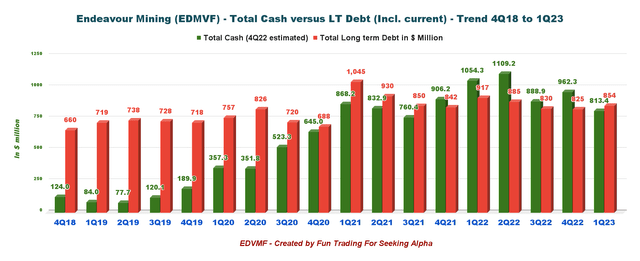
EDVMF Balance Sheet (EDVMF Presentation)
4 – Quarterly Gold Production Analysis
4.1 – Gold Production
EDVMF Quarterly Gold Production History (Fun Trading)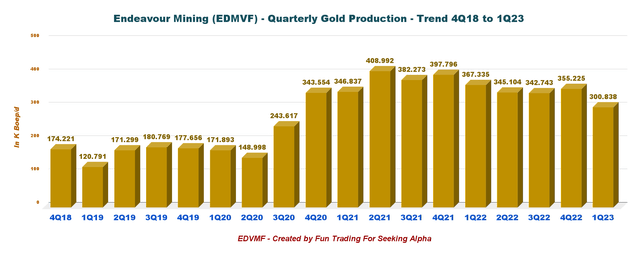
1Q23 gold production from continuing operations was 300,838 Au ounces, significantly down from 1Q22. Production was also down 15.3% sequentially.
Sebastien de Montessus said in the conference call:
On the operational front, we’re tracking in line with our guidance, as we expect production weighted towards the second half of the year due to mine sequencing across the Group.
4.2 – Gold production per mine. Comparison between 1Q22 and 1Q23
Production for 1Q23 decreased significantly compared with 1Q22. Production was significantly down at Sabodola, Hounde, Mana, and Boungou with the loss of Karma sold earlier.
EDVMF Quarterly gold production per mine 1Q22 versus 1Q23 (Fun Trading)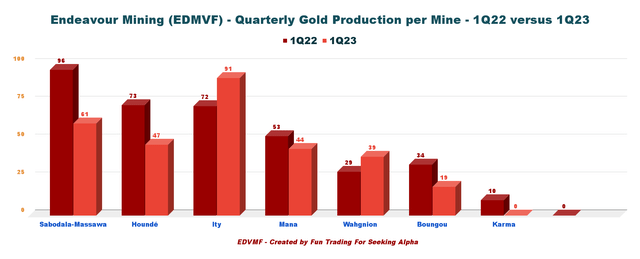
4.3 – Quarterly Gold price realized and AISC
AISC for all operations increased slightly this quarter to $1,022 per ounce, which is still excellent but going steadily higher, unfortunately.
EDVMF Quarterly Gold Price and AISC History (Fun Trading)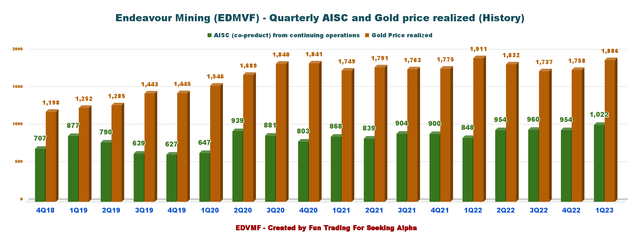
5 – Sabodala-Massawa project expansion progressing on budget
Production is expected in 2024.
EDVMF: Sabodala Massawa Expansion (EDVMF Presentation)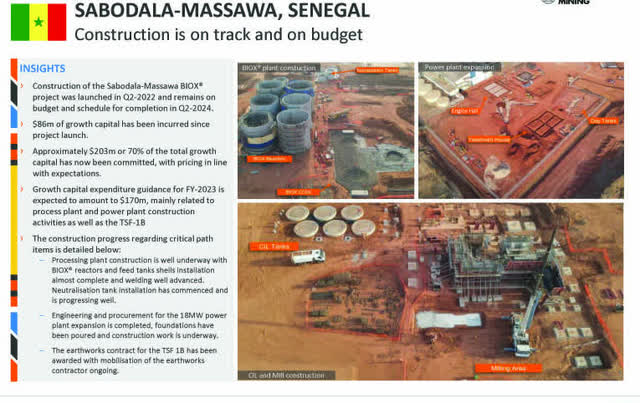
Sebastien de Montessus, President and CEO, said in the conference call:
Sabodala-Massawa…Its expansion project is progressing on budget with 70% of the $290 million initial capital cost now committed. It is also tracking on schedule with first gold from the BIOX plant expected during the second quarter of next year.
6 – 2023 Guidance – 1.325-1.425 Moz with AISC of $940-$995 per ounce. Unchanged
EDVMF 2023 Guidance (EDVMF Presentation)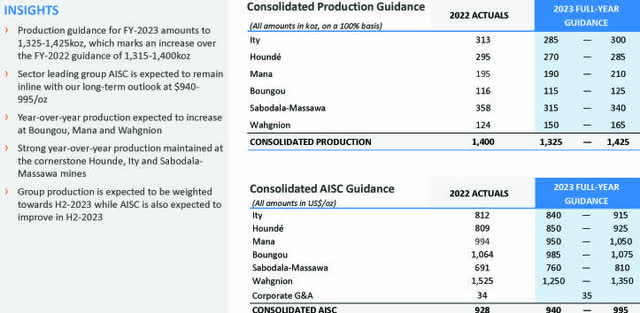
Commentary And Technical Analysis
EDVMF TA Chart Short-Term (Fun Trading StockCharts)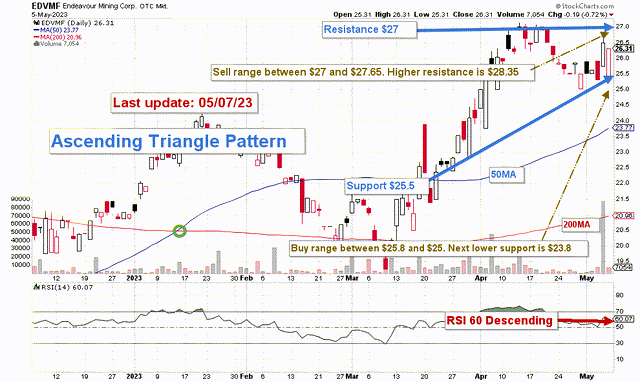
Note: The chart is adjusted for dividends.
Ascending triangles are a bullish formation that anticipates an upside breakout.
The trading strategy I suggest is to gradually sell about 40% of your EDVMF position between $27 and $27.65 with possible higher resistance at $28.35 and accumulate between $25 and $25.8 with potential lower support at $23.8.
The gold price is moving nicely and should help the stock in 2023. However, volatility in this industry is notorious.
Thus, the best-adapted approach is to sell short-term LIFO while keeping a core long-term position for a much higher final target. It is what I am suggesting in my marketplace, “The Gold and Oil Corner.”
Watch the gold price like a hawk.
Warning: The TA chart must be updated frequently to be relevant. It is what I am doing in my stock tracker. The chart above has a possible validity of about a week. Remember, the TA chart is a tool only to help you adopt the right strategy. It is not a way to foresee the future. No one and nothing can.
Editor’s Note: This article discusses one or more securities that do not trade on a major U.S. exchange. Please be aware of the risks associated with these stocks.
Read the full article here