


Intro
Suppose we pull up a long-term iShares Biotechnology ETF (NASDAQ:IBB) chart. In that case, we see that although shares have managed to make higher highs & higher lows since mid-2015 (confirmed by the rising multi-year depicted trend-line), the significant fall-off in shares from the fund’s 2021 highs resulted in the ETF’s 10-month moving average moving below its corresponding 40-month average. Suffice it to say, that shares of IBB have traded below their 40-month moving average for almost two years now which could be an ominous sign.
Furthermore, the bearish divergences we see in both the fund’s RSI momentum indicator as well as the MACD point to at least a retest of the multi-year depicted trend-line below. Whether long-term support holds at this stage is unknown at this stage but if support were not to hold, long investors should be fully aware of the significant downside risk from that point. What we mean by this is due to the stellar rally IBB enjoyed between 2011 & 2015, limited long-term support exists below the depicted trend line on the chart below.
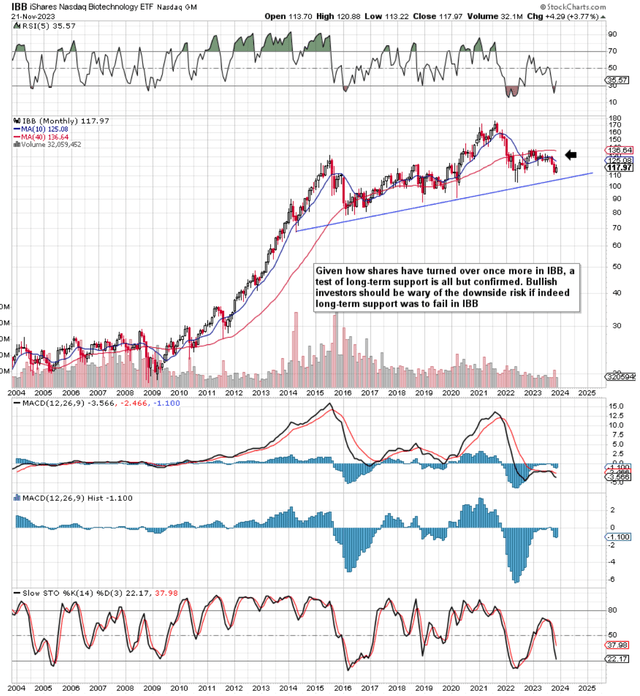
IBB Technical Chart (Stockcharts.com)
12-Month Daily Chart
As we see below, shares of IBB managed to bottom in late October this year but the rally out of that bottom has failed to gain any traction. Volume trends (as we see below through the OBV indicator) have remained weak as the upside gap in early November was immediately filled. Suffice it to say, what long investors need to be mindful of here is that even if IBB manages to stay off its lows in upcoming sessions, look at the wall of overhead resistance which remains directly above (From $120 a share) the fund at this stage. IBB’s daily chart ties in with what we were discussing earlier in IBB’s long-term chart in that the technicals point to more downward momentum over time.
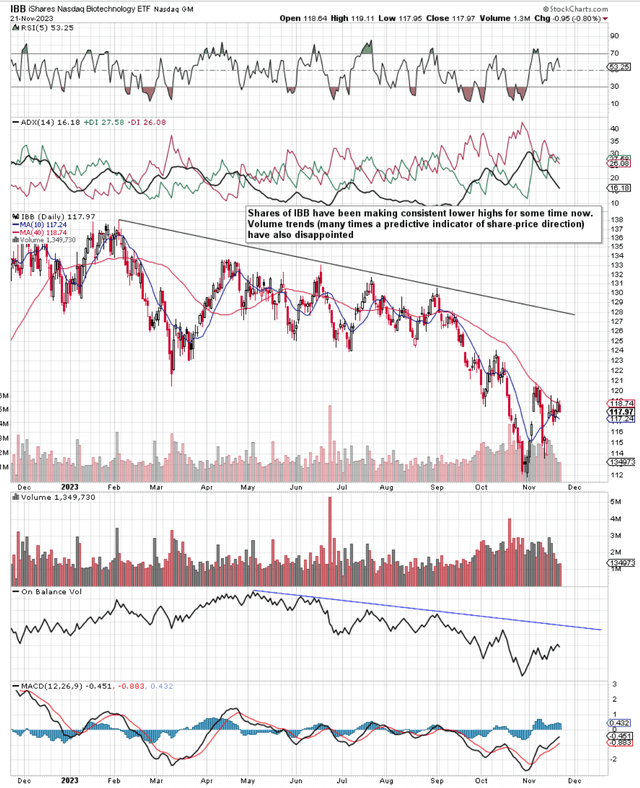
IBB Daily 12-Month Chart (Stockcharts.com)
IBB ETF Risk
Apart from IBB’s technicals, we see below that short interest in the fund at present comes in above 19% (Approximately $1.2 billion of shares currently sold short) & long-term tracking errors (both for 3 & 5 years) come in very much on the high side. Short-sellers invariably are sophisticated speculators who do ample due diligence to justify the risk they take. A high short-interest ratio should not be dismissed lightly. Furthermore, IBB’s high tracking error (13%+ & 15%+ for the fund’s 3-year & 5-year, respectively) demonstrates above-average risk given how far these numbers are from the benchmark. A high tracking error combined with a high short-interest ratio points towards a high probability that IBB will continue to diverge from the benchmark.
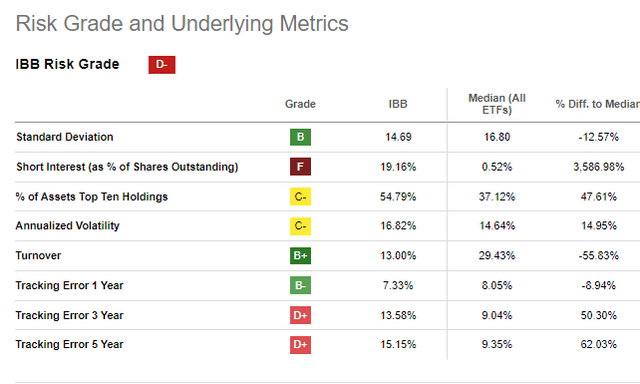
IBB Risk Grade & Underlying Metrics (Stockcharts.com)
Strategy
Although we are bearish on the fund, the high short-interest ratio leads us to use options instead of shorting the fund outright. Therefore, what we are looking at is a long-term diagonal spread where we are buying the January’25 $140 put option and then subsequently selling the January’24 $115 put against this long position. This is a long-term position in that our $140 January’25 put option mirrors being short the fund due to its high delta component (96+). One could just buy this option but our objective is to consistently sell short-term out-of-the-money put options against it (mirroring a covered put strategy). Our cost basis for the position is $119.80 (the current price of IBB is approximately $118 a share) so we are already well above 50% in terms of booking a profit in the position. The probability of profit in our setup will only increase as we continue to sell more near-term out-of-the-money puts against our deep-in-the-money put option.
Long-Term Put Diagonal Risk
If we were to use a traditional covered put strategy (by shorting IBB at its prevailing share price and selling the subsequent $115 January call), this would cost us in the region of $11.600 (per covered put) as opposed to $2.020 per long-term diagonal. Therefore straight away, we are risking far less whilst controlling 100 shares (being short) of the fund. How we mitigate risk however with our strategy is ensuring we always have sufficient time & delta in our deep-in-the-money put option over time. We accomplish this by rolling up & out this option if indeed this is warranted at any moment in time. We will manage this position over time and alert readers to changes in the position & portfolio in the comment section below.
Conclusion
To sum up, based on IBB’s technicals and risk metrics where we see elevated short-interest plus above-average tracking errors, we now have a delta-short position in the fund. The strategy we are using is a long-term diagonal where the aim is to consistently bring in income through the selling of near-dated put options. We look forward to continued coverage.
Read the full article here