This article was published on Dividend Kings on Tuesday, June 6th.
—————————————————————————————
When markets go crazy, life-changing opportunities can occur. I’m talking rich retirement-making blue-chips buys.
The kinds of investments that you tell your kids and grandkids about.
The rich retirement dream stocks that literally made Warren Buffett a living legend.
Today British American Tobacco p.l.c. (NYSE:BTI) represents just such a table-pounding, Buffett-style, “fat pitch” anti-bubble Ultra SWAN dividend aristocrat opportunity.
Let me show you why this 9% yielding aristocrat represents a generational buying opportunity that could not only generate close to 300% returns in the next six years but could change your life.
Let me show you why it’s literally the best time in 23 years to buy this 9% yielding global dividend aristocrat.
Why Wall Street Likely Hates British American Right Now…
A lot of Dividend Kings members have been asking me why BTI has been in such a downtrend lately.
Ycharts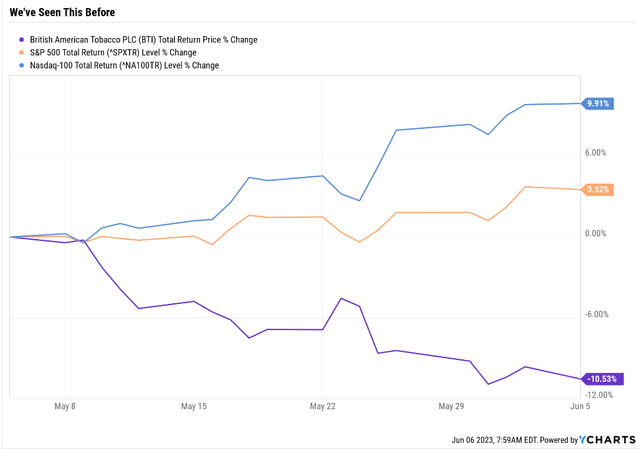
It’s understandable that in a month when the Nasdaq soared 10% and the market had a great month, an 11% decline might scare BTI longs.
The Truth About Stocks: Only Tech Is Working Right Now
Wide Moat Research 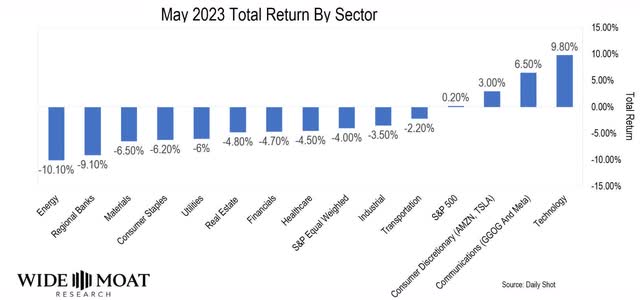
In the month of May, nothing other than tech was working. The coming recession is being priced into the market via crashing cyclicals like energy, materials, and regional banks.
OK, so that might make sense, but isn’t BTI a defensive, recession-resistant global aristocrat? One that is USUALLY 50% less volatile in down markets? So what the heck is going on?
Why British American Is Likely Falling Right Now: Tech Bubble 3.0
Charlie Bilello 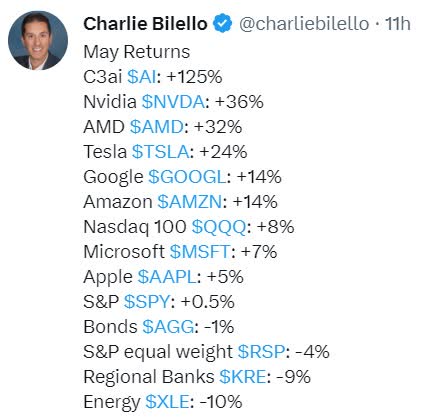
The S&P equal weight fell 4% in May, a bad month for stocks.
In contrast, AI-big tech had a fantastic bubblicious month.
There is virtually no amount of actual good news that justifies a stock rising 125% in a month as C3.ai, Inc. (AI) did.
Ok, but what does this have to do with BTI?
This Is Just Like The Tech Bubble Of The Late 90s
Ycharts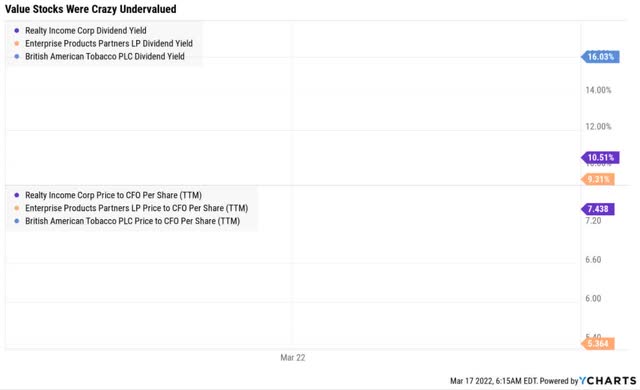
From 1997 to March 2009, value stocks, including midstreams, REITs, BTI, and Berkshire Hathaway Inc. (BRK.A), fell 50% while the Nasdaq almost tripled.
“To heck with value; long live growth! No price too high for Internet stocks!”
This was the battle cry of the FOMO (fear of missing out) momentum chasing growth investors in the late 1990s. And for three years, they seemed like geniuses, and Buffett and other value investors seemed like washed-up fools.
Do you remember what happened next? Buffett and value investors were proven right, and “no price too high” Dave Portnoy-style momentum chasers got slaughtered.
The Revenge Of The Real Economy: Value Slaughters Growth: March 2000 To March 2010
Portfolio Visualizer Premium 
The Nasdaq was cut in half, BTI was up 14X, EPD was up 7X, and Realty was up 6X.
The Nasdaq was so overvalued in 2000 that it took 15 years for investors who bought at the top to break even.
The Revenge Of The Real Economy: Value Slaughters Growth: March 2000 To October 2014
Portfolio Visualizer Premium 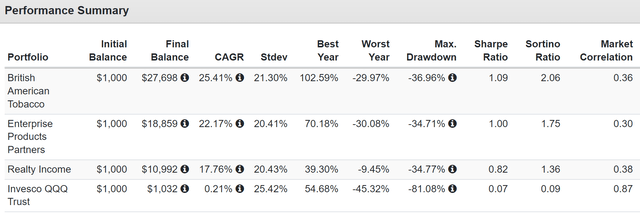
Now am I saying that today’s tech bubble is as bad as the one in 2000? Heck no. Today’s market is just 10% overvalued, and in March 2000, the S&P hit a record 50% historical premium.
Today’s Nasdaq is also about 10% historically overvalued, and big tech is the widest moat and most profitable group of companies in history.
But is there likely a bit of “sell value to buy AI big tech” going on? You bet your butt there is!
It’s called window dressing. When hedge funds are facing a quarterly report in July where clients are only going to want to know the answer to “How much AI do we own?” the logical approach is to sell value and buy Nvidia Corporation (NVDA) at any price.
- So they can say, “we are x% invested in NVDA.”
FAST Graphs, FactSet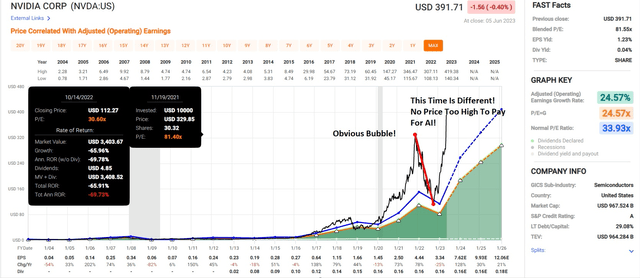
Do I need to say more? No reasonable human being can look at this chart and say NVDA isn’t in a bubble.
So basically, what’s wrong with BTI? Absolutely nothing; it’s big tech trading like it’s literally 1999, and the party will never stop.
In God we trust. All others must bring data.” – American Engineer and Statistician Edward Deming.
But all I’ve proven so far is that big tech is overvalued, and some AI-stocks are insanely overpriced. Now I’ll prove that there is nothing wrong with BTI’s thesis. In other words, let me show you exactly why BTI isn’t a value trap.
Why Wall Street Is Dead Wrong On This 9% Yielding Global Aristocrat
First, here’s the proof that BTI isn’t a value trap.
FAST Graphs, FactSet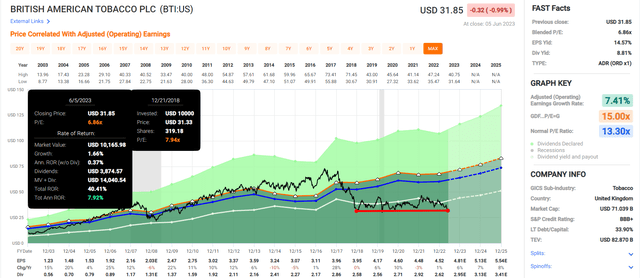
BTI has been growing steadily during its bear market, raising its dividend and delivered 8% annual returns.
Sure, that’s not as good as the S&P but only those who foolishly bought during the high-yield bubble have lost money.
- BTI was 50% overvalued
- “low-interest rates! TINA! There is no price too high for dividend stocks!”
Anyone who paid literally the same premium for BTI that investors paid for the S&P 500 (SP500) at the top of the tech bubble can’t complain about poor returns since the height of the bubble.
British American’s Growth Rates Since 2016 (When The Bear Market Started)
- Dividend: 4.5% annual growth
- Sales: 5.6% annual growth
- Earnings: 6.4% annual growth
- Operating cash flow: 9.8% annual growth
- Free cash flow: 10.7% annual growth.
OK, so investors who didn’t buy in the “no price too high for dividend stock” TINA bubble haven’t lost money.
And objectively, BTI has been growing at solid rates for the last seven years.
But what about the future? Maybe BTI’s growth outlook has collapsed? Maybe it’s slowly dying, so it’s trading at the lowest P/E in 20 years?
FAST Graphs, FactSet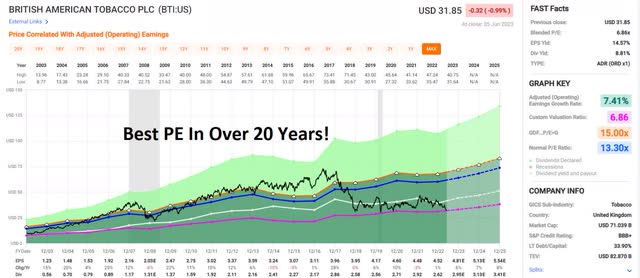
The last time BTI was this undervalued, here’s what happened next.
The Last Time British American Was This Undervalued
| Time Frame (Years) | Annual Returns | Total Returns |
| 1 | 109% | 109% |
| 3 | 45% | 208% |
| 5 | 42% | 487% |
| 7 | 40% | 953% |
| 10 | 30% | 1231% |
| 15 | 25% | 2742% |
(Source: Portfolio Visualizer Premium.)
OK, so BTI came roaring back from being 50% undervalued and delivered Buffett-like, Nasdaq-smashing life-changing returns. But what if its growth will be negative from now on?
| Metric | 2022 Growth | 2023 Growth Consensus | 2024 Growth Consensus | 2025 Growth Consensus |
2026 Growth Consensus |
| Sales | -2% | 5% | 3% | 3% | 8% |
| Dividend | 6% | 13% | 6% | 8% (25-year dividend growth streak) | 3% |
| EPS | 1% | 6% | 7% | 8% | 9% |
| Operating Cash Flow | -2% | 16% | 3% | 4% | 10% |
| Free Cash Flow | -2% | 12% | 6% | 5% | 10% |
| EBITDA | -2% | 8% | 4% | 3% | NA |
| EBIT (operating income) | -2% | 12% | 4% | 4% | NA |
(Source: FAST Graphs, FactSet.)
Nope, not a dying company in the medium-term.
OK, so what about the long-term? What if BTI is about to get hammered by the FDA’s menthol ban, which BTI says might be coming in 2027?
What if the FDA’s nicotine regulations destroy its growth from 2028 to 2030?
What if global regulations, plain packaging laws, and a failure to generate profits on reduce-risk products or RRPs mean its growth prospects beyond 2027 become negative?
Management is guiding for 7% to 9% long-term EPS and dividend growth!
OK, but maybe management is full of it? Maybe they are lying, and this is a dying company?
There are 18 analysts who cover BTI for a living on Wall Street. Here’s what they think is BTI’s long-term growth outlook.
British American Median Long-Term Growth Consensus
FAST Graphs, FactSet
Slightly below management’s guidance range but hardly worthy of a 6.7X cash-adjusted P/E that prices in -3.6% long-term growth.
You don’t need a Ph.D. from MIT to know that 6.5% is more than -3.6%.
BTI is so undervalued right now; it’s an anti-bubble stock! As long as it grows at 0% or faster, the dividend will always remain safe and long-term investors can’t lose money.
- As long as they avoid becoming forced sellers for emotional or financial reasons
- such as “selling out of disgust to chase AI stocks”;)
OK, so maybe BTI’s business is expected to keep growing long into the future, and maybe it’s been growing at a steady rate for the entire bear market, but maybe the balance sheet is the issue? If a company is going to go bankrupt, then that might explain a crashing stock price.
British American has a BBB+ credit rating, meaning S&P thinks there is a 5% chance it will go bankrupt in the next 30 years.
OK, but maybe something terrible has happened recently, and S&P might not have downgraded BTI yet. For example, maybe the debt/cash flow or leverage ratio is rising to dangerous levels?
- 2.9 debt/EBITDA right now vs. 3.0 safe according to rating agencies
- 2024 consensus: 2.7
- 2025 consensus: 2.5
- 2026 consensus: 2.7.
Nope, BTI’s debt levels are relatively safe and getting safer.
BTI’s New CEO
BTI investor relations 
What about a new CEO? Maybe Wall Street is worried that this guy can’t execute as well as previous management?
Tadeu Marroco has been with BTI since 1992. He became CEO in May and was CFO since 2019.
Before that, he was Director, Group Transformation, in charge of integrating the Reynolds acquisition and moving BTI to a reduced-risk product or RRP future.
In other words, he’s been part of every major decision BTI has made for the last few years when BTI has been firing on all cylinders.
Firstly, let me address a frequently asked question: Will there be a change in our strategy? No. I am clear that the strategy we created in 2019 is right. I am confident that we can execute it successfully.” – Tadeu Marroco.
No change in strategy since it’s been a successful one, as we’ve just seen.
OK, but maybe there is some deep dark, terrible secret that the market is picking up that the headlines, analysts, and rating agencies are missing?
On Wall Street, bond investors are the “smart money” because they only care about the preservation of capital. They don’t care about stock prices and rarely get faked out by scary headlines.
FactSet Research Terminal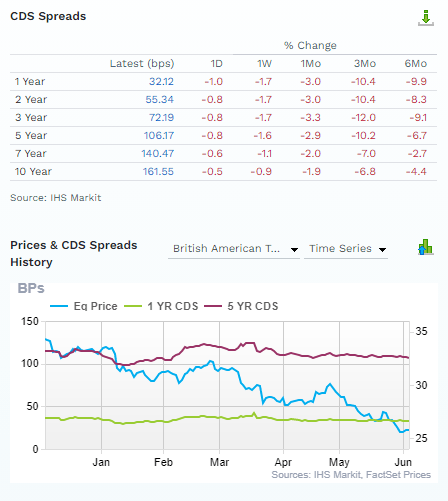
Credit default swaps are publicly traded insurance policies bond investors take out against potential default. And they tell us in real-time the fundamental bankruptcy risk that bond investors are pricing in for a company.
For BTI, the risk of default has been falling over the last one day to 6 months while the stock price has been tanking.
So the smart money is growing MORE, not less, confident in BTI’s future. And guess what? BTI’s longest-duration bond matures in November 2055, 32 years from now.
But how can that be when tobacco is a dying industry?
A pack of 20 cigarettes (equivalent; a standard pack contains 25 sticks in Australia) now costs roughly $26, well above the $15 retail price for a premium pack in the U.K., $6.50 in the U.S., and around $5.50 on average globally, according to the World Health Organization.
Assuming the Australian experience is applicable to price elasticity in other markets, it appears a great deal of headroom remains for price increases globally. At 4% real pricing (based on 6% nominal price/mix and 2% global inflation), this crude calculation suggests that it will be 2046 before global pricing reaches levels at which price elasticity increased in Australia. This is comfortably longer than 20 years, the benchmark period that we expect wide-moat companies to continue generating economic rent.” – Morningstar (emphasis added).
By Morningstar’s estimate, BTI’s legacy tobacco business has 23 years before it can no longer raise prices faster than volume declines.
FactSet Research Terminal
Analysts agree, with positive organic growth expected through 2026. In fact, analysts think BTI’s sales will gradually accelerate in the coming years.
So what exactly do 6.5% long-term growth and a very secure 9% yield backed up by a BBB+ credit rating and 23-year dividend growth streak mean?
| Investment Strategy | Yield | LT Consensus Growth | LT Consensus Total Return Potential |
| British American Tobacco | 9.0% | 6.5% | 15.5% |
| ZEUS Income Growth (My family hedge fund) | 4.1% | 9.8% | 13.9% |
| Vanguard Dividend Appreciation ETF | 1.9% | 10.7% | 12.6% |
| Nasdaq | 0.8% | 11.2% | 12.0% |
| Schwab US Dividend Equity ETF | 3.6% | 7.6% | 11.2% |
| REITs | 3.9% | 7.0% | 10.9% |
| Dividend Champions | 2.6% | 8.1% | 10.7% |
| Dividend Aristocrats | 1.9% | 8.5% | 10.4% |
| S&P 500 | 1.7% | 8.5% | 10.2% |
| 60/40 Retirement Portfolio | 2.1% | 5.1% | 7.2% |
(Source: FactSet, Morningstar.)
How about Nasdaq-smashing return potential and a yield of almost 10%?
Wow, come on, a tobacco stock beating the Nasdaq? Are you high?
No, I’m stone-cold sober!
Total Returns Since 1999
Portfolio Visualizer Premium 
Twenty-four years of beating the Nasdaq and running circles around the S&P 500.
Portfolio Visualizer Premium 
Average annual rolling returns of 16%, just like analysts expect in the future.
14.7% Annual Dividend Growth For 22 Years
Dividends Per $1000 initial investment, in USD (Portfolio Visualizer Premium )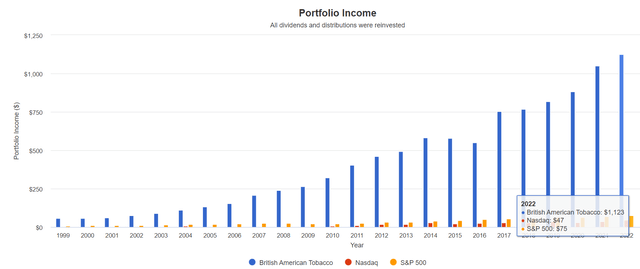
In British Pounds, BTI has been paying rising dividends every year for 23 years. It’s a global aristocrat and in 2025, will become a dividend champion.
- it would be an aristocrat if it were in the S&P 500.
BTI’s management has a stated policy of a 65% payout ratio.
- Rating agencies consider 85% safe for this industry
- MO’s is 80%
- PM is 75%.
BTI’s payout ratio is 61% today, the lowest payout ratio of the tobacco giants.
Ok, so this is all very compelling, but it’s all historical returns, and future guidance and analyst estimates, and rating agency and bond safety models.
What about actual cold, hard facts?!
British American Delivers Another Solid 6 Months Of Cold Hard Facts
Every six months, BTI provides an update on its business, as is typical of UK companies.
How fares this “value trap” that has “one foot in the grave” to hear bears tell it?
We increased the number of consumers of non-combustible products1 by a further 900,000 in Q1…
We are on track to deliver our £5bn revenue ambition in 2025, with profitability in 2024, irrespective of the timing of the transfer of our Russian and Belarusian businesses.” – CEO.
BTI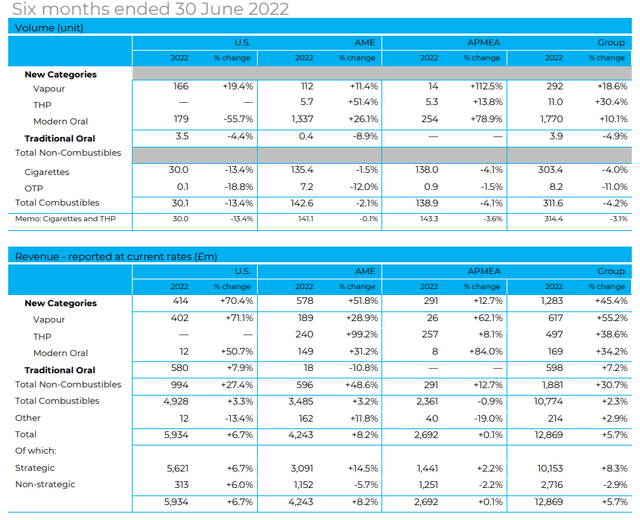
BTI’s total sales were up 6%, and reduced-risk product sales were up 45%.
- 4% constant currency sales growth
- RRP sales up 45% in constant currency.
That’s despite a 4% decline in volume led primarily by disappointing results in the US.
- See the risk section for a discussion on this.
Vaping, which younger nicotine users use 9X more often than heat sticks, saw the fastest growth of 55%.
Heat sticks, which is the most lucrative type of RRP, saw sales grow 39%, or 44% in constant currency.
BTI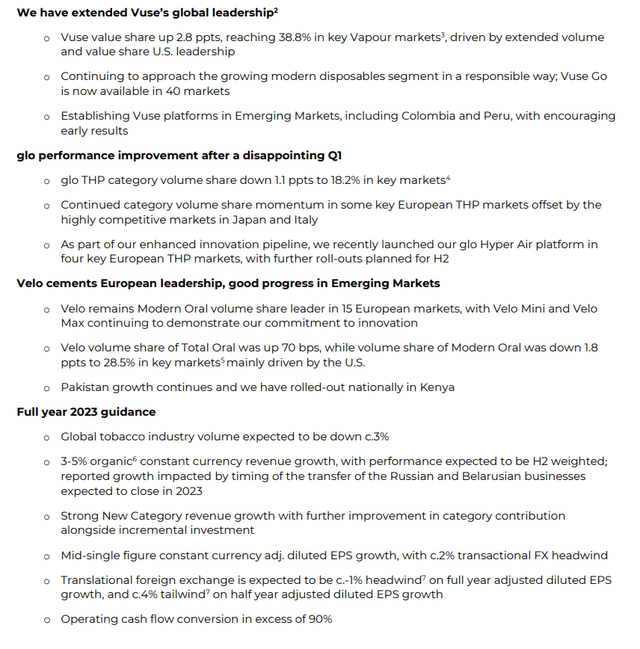
BTI is struggling in some markets competing with iQos, specifically Italy and Japan, where Philip Morris launched its heat sticks (after inventing the category).
VUSE continues to dominate with 39% market share in the markets where it’s sold, a gain of 3%.
Velo oral nicotine punches have 28% market share.
And for 2023, guidance management now expects volume declines of 3%, basically the same rate as recent years.
It expects 3% to 5% constant currency growth, compared to 5% for the analyst consensus.
Management is guiding for 4% to 6% EPS growth in 2023, compared to a 6% consensus.
So now we have another six months worth of cold, hard facts.
And the facts say BTI’s long-term thesis remains completely intact.
Valuation: Crazy, Stupid, Cheap
So we’ve just debunked the idea that BTI is a dying business, a value trap, and doesn’t have one foot in the grave, nor is it about to go bankrupt.
It’s got a solid long-term plan to transition to a 100% smoke-free future, and that plan is on track.
So now, here’s the valuation, the lowest P/E in over 20 years.
| Metric | Historical Fair Value Multiples (all years) | 2022 | 2023 | 2024 | 2025 | 2026 |
12-Month Forward Fair Value |
| 13-year median yield | 4.56% | $61.62 | $62.94 | $62.94 | $73.46 | $72.81 | |
| 25-year Average Yield | 4.29% | $65.50 | $66.90 | $66.90 | $78.09 | $77.39 | |
| Earnings | 13.30 | $60.12 | $63.44 | $67.56 | $73.02 | $80.33 | |
| Average | $62.33 | $64.38 | $65.74 | $74.79 | $76.72 | $64.98 | |
| Current Price | $32.43 | ||||||
|
Discount To Fair Value |
47.97% | 49.63% | 50.67% | 56.64% | 57.73% | 50.09% | |
| Upside To Fair Value | 92.21% | 98.52% | 102.70% | 130.61% | 136.56% | 109.22% | |
| 2023 EPS | 2024 EPS | 2023 Weighted EPS | 2024 Weighted EPS | 12-Month Forward EPS | 12-Month Average Fair Value Forward PE | Current Forward PE |
Forward Cash-Adjusted PE |
| $4.77 | $5.08 | $2.66 | $2.25 | $4.91 | 13.2 | 6.6 | 6.7 |
BTI’s historical market-determined P/E, which is how hundreds of millions of cumulative income investors have priced its risk profile and growth opportunities over 20 years, is between 13 and 14.
I conservatively estimate it’s worth 13.2X earnings, and today trades at 6.6X forward earnings and 6.7X cash-adjusted earnings.
That’s a 50% historical discount that is literally half the valuation private equity is paying for deals and lower than the average Shark Tank deal (7X) in the first ten seasons.
This isn’t just a good deal; it’s a Buffett-style, anti-bubble, table-pounding “fat pitch” Ultra Value great deal.
British American Tobacco 2025 Consensus Total Return Potential
FAST Graphs, FactSet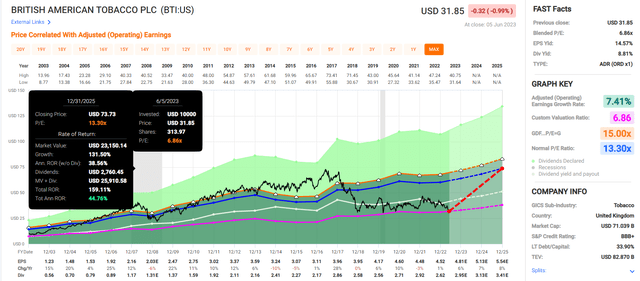
BTI is so undervalued that if it grows as expected by 2025 it offers 160% total return potential, or Buffett-like 45% annual total returns.
That’s not just Buffett-like; it’s similar to Buffett’s AMEX during the Salad Oil swindle 49% annual returns.
- the investment that made Buffett a legend
- and the profits from which bought Berkshire.
British American Tobacco 2029 Consensus Total Return Potential
FAST Graphs, FactSet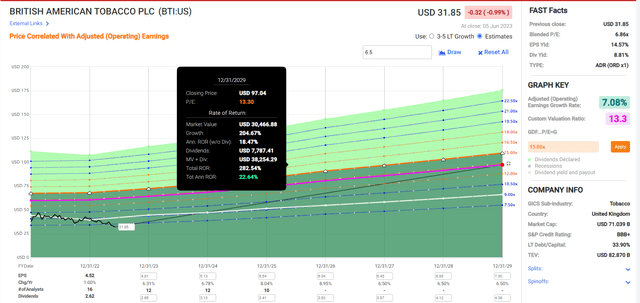
280% return potential, a nearly 4X return by 2029, and 23% annual returns.
That’s 4.5X more than the S&P 500 consensus.
That’s the power of the ultimate Buffett-style anti-bubble Ultra SWAN global aristocrat.
Risk Profile: Why British American Isn’t Right For Everyone
There are no risk-free companies, and no company is right for everyone. You have to be comfortable with the fundamental risk profile.
BTI’s Risk Profile Includes
- regulatory risk (global and US) – plain packaging laws, menthol ban, nicotine level regulation, RRP tax policies, RRP approvals
- smoke-free transition risk (PM is the industry leader)
- margin risk: RRP is currently unprofitable
- M&A execution risk (BTI tends to make occasional giant deals)
- labor retention risk (tightest job market in over 55 years)
- currency risk (including dividends)
- interest rate risk: rolling over debt at potentially much higher interest rates (could cause growth to come in lower than currently expected).
46% of sales are from the US, which was the worst part of the business in the first six months of 2023.
BTI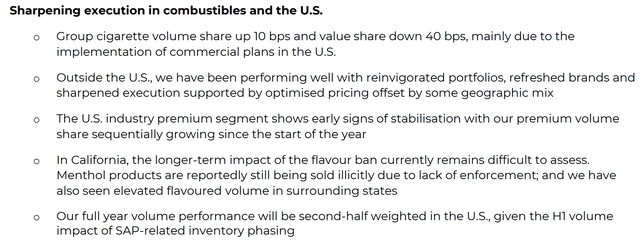
BTI lost 0.4% market share mostly to discounted cigarette brands.
BTI
BTI’s U.S. volumes fell 13.4%, which management attributed to a few headwinds, primarily California’s menthol ban and high inflation hurting consumer spending.
- Dollar General fell 16% on its earnings day after reporting the same thing
We are starting to see early signs of stabilization in the U.S. industry premium segment and have built sequential volume share since the start of the year. Returning combustibles to consistent value creation is critical to our multi-category strategy in the U.S. We are taking action, although it will take some time to carefully and thoroughly implement our plans.” – CEO.
Management says the back half of 2023 isn’t likely much better in the U.S. In addition, the launch of Glo in several markets was “underwhelming.”
Glo is the heat stick brand BTI is using to battle PM’s iQOS, and this is expected to be the most lucrative part of the RRP portfolio.
If BTI finds that it can’t compete with PM effectively, then it’s runway to a smoke-free future gets longer.
Now it has an estimated 23 years to get to 100% RRP sales, but the biggest risk to BTI’s thesis is poor execution on RRPs.
How do we quantify, monitor, and track such a complex risk profile? By doing what big institutions do.
Long-Term Risk Management Analysis: How Large Institutions Measure Total Risk Management
DK uses S&P Global’s global long-term risk-management ratings for our risk rating.
- S&P has spent over 20 years perfecting its risk model
- which is based on over 30 major risk categories, over 130 subcategories, and 1,000 individual metrics
- 50% of metrics are industry specific
- this risk rating has been included in every credit rating for decades.
The DK risk rating is based on the global percentile of a company’s risk management compared to 8,000 S&P-rated companies covering 90% of the world’s market cap.
BTI Scores 100th Percentile On Global Long-Term Risk Management
S&P’s risk management scores factor in things like:
- supply chain management
- crisis management
- cyber-security
- privacy protection
- efficiency
- R&D efficiency
- innovation management
- labor relations
- talent retention
- worker training/skills improvement
- occupational health & safety
- customer relationship management
- business ethics
- climate strategy adaptation
- sustainable agricultural practices
- corporate governance
- brand management
- interest rate risk management.
BTI’s Long-Term Risk Management Is Tied For The Best In The Master List (100th Percentile In The Master List)
| Classification | S&P LT Risk-Management Global Percentile |
Risk-Management Interpretation |
Risk-Management Rating |
| BTI, ILMN, SIEGY, SPGI, WM, CI, CSCO, WMB, SAP, CL | 100 | Exceptional (Top 80 companies in the world) | Very Low Risk |
| Strong ESG Stocks | 86 |
Very Good |
Very Low Risk |
| Foreign Dividend Stocks | 77 |
Good, Bordering On Very Good |
Low Risk |
| Ultra SWANs | 74 | Good | Low Risk |
| Dividend Aristocrats | 67 | Above-Average (Bordering On Good) | Low Risk |
| Low Volatility Stocks | 65 | Above-Average | Low Risk |
| Master List average | 61 | Above-Average | Low Risk |
| Dividend Kings | 60 | Above-Average | Low Risk |
| Hyper-Growth stocks | 59 | Average, Bordering On Above-Average | Medium Risk |
| Dividend Champions | 55 | Average | Medium Risk |
| Monthly Dividend Stocks | 41 | Average | Medium Risk |
(Source: DK Research Terminal.)
BTI’s risk-management consensus is in the top 80 of all companies S&P rates.
The bottom line is that all companies have risks, and BTI is exceptional at managing theirs according to S&P.
How We Monitor BTI’s Risk Profile
- 18 analysts
- three credit rating agencies
- 21 experts who collectively know this business better than anyone other than management
- and the bond market for real-time fundamental risk-assessment.
When the facts change, I change my mind. What do you do, sir?” – John Maynard Keynes.
There are no sacred cows at iREIT or Dividend Kings. Wherever the fundamentals lead, we always follow. That’s the essence of disciplined financial science, the math behind retiring rich and staying rich in retirement.
Bottom Line: British American Is The Ultimate 9% Yielding Buffett-Style Dividend Aristocrat Table-Pounding Buy
Dividend Kings Automated Investment Decision Tool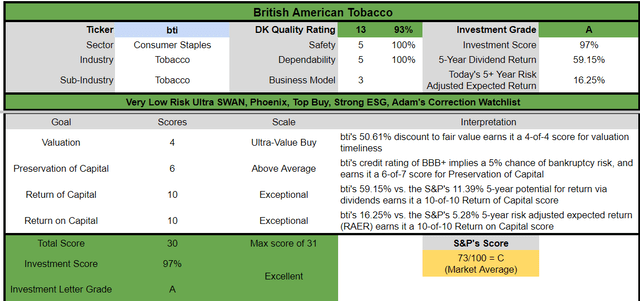
Let me be clear: I’m NOT calling the bottom in BTI (I’m not a market-timer).
Even Ultra SWANs and aristocrats can fall hard and fast in a bear market.
Fundamentals are all that determine safety and quality, and my recommendations.
- over 30+ years, 97% of stock returns are a function of pure fundamentals, not luck
- in the short term; luck is 25X as powerful as fundamentals
- in the long term, fundamentals are 33X as powerful as luck.
While I can’t predict the market in the short term, here’s what I can tell you about BTI.
- very safe 9.0% yield (1.0% risk of a dividend cut in a severe recession), growing 6% to 7% long-term
- 15% to 16% long-term return potential vs. 10.2% S&P
- historically 50% undervalued
- 6.6X earnings vs. 12.5 to 13.5X historical
- 6.7X cash-adjusted earnings (anti-bubble blue-chip)
- 280% consensus return potential over the next six years, 23% annually, 4.5X more than the S&P 500
- About 200% better risk-adjusted expected returns than the S&P 500 over the next five years
- 5X more income of the S&P over the next five years.
In these insane times, when hyper-volatile cyclical chip makers trade for 80X earnings, you can still find absolutely jaw-dropping blue-chip deals.
Nothing in BTI’s fundamentals justifies its 11% decline in the last month or 17% YTD decline.
The best available evidence points to a tech bubble sucking the air out of everything else, just like in the tech bubble of 2000.
And we know how that ended.
I can’t guarantee success with BTI or any company. The Howard Marks/John Templeton certainty limit states that even when all the data and fundamentals say a stock is a sure thing, you can only be 80% certain of success.
But that’s the equivalent of “I’ll die on this hill” confidence, and that’s what I have with BTI.
It’s my single largest holding! And every six months when management provides updated fundamentals they almost never disappoint.
The smoke-free future plan remains on track.
Guidance for 2023 and long-term is solid.
The balance sheet is strong, and the new CEO is a 31 year veteran who has been directly responsible for BTI’s solid results in the last seven years.
British American’s Growth Rates Since 2016 (What The New CEO Was Largely Responsible For)
- Dividend: 4.5% annual growth
- Sales: 5.6% annual growth
- Earnings: 6.4% annual growth
- Operating cash flow: 9.8% annual growth
- Free cash flow: 10.7% annual growth.
This is the same long-term consensus growth analysts expect in the future.
A company objectively growing at 6% to 7% is priced at -3.6% because of a tech bubble!
This isn’t just illogical; it’s downright insane.
BTI is a deal so good that it’s 50% cheaper than private equity deals!
BTI is a deal so good; it’s cheaper than Shark Tank deals!
BTI is a deal so good that it hasn’t been this undervalued for 23 years!
BTI is a deal so good it ought to be criminal because anyone buying today is basically robbing the seller, who is temporarily insane due to AI-mania;)
This is a generational buying opportunity that won’t last long. It’s an opportunity that I can say with 80% confidence you will regret if you don’t take advantage of.
In 5+ years, when BTI has skyrocketed on the back of steady de-leveraging and de-risking of its business, this opportunity will be SO OBVIOUS.
To paraphrase Casablanca:
If British American leaves the ground and you haven’t bought some, you’ll regret it. Maybe not today. Maybe not tomorrow, but soon and for the rest of your life.”
Editor’s Note: This article discusses one or more securities that do not trade on a major U.S. exchange. Please be aware of the risks associated with these stocks.
Read the full article here


