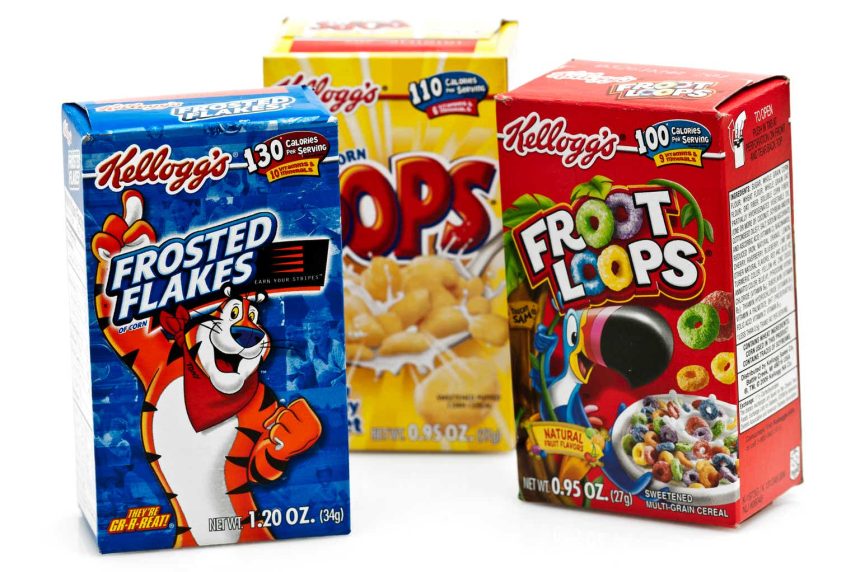
Overview
Kellogg Company (NYSE:K) is one of the largest food companies in the US behind such stalwarts as Kraft Heinz (KHC) and General Mills (GIS).
companiesmarketcap.com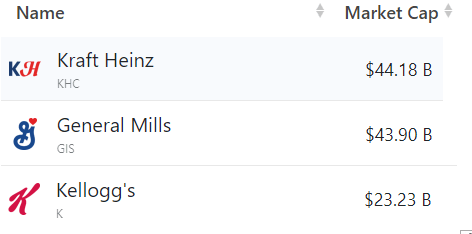
If we compare Kellogg’s total return (including dividends) for the last 12 months it has underperformed the S&P 500 (SPY) significantly -4% to +19%.
Seeking Alpha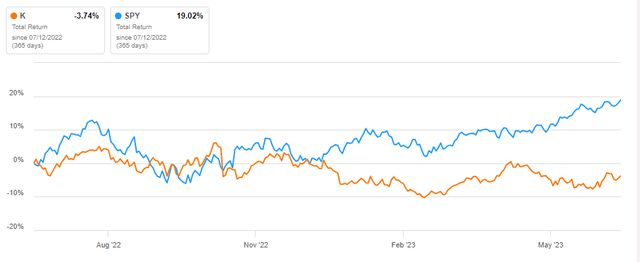
That indicates that generally speaking, it has not been a good year for K. Kellogg’s best-known brands include Special K, Cheez-It, and Pringles as well as other iconic brands such as Rice Krispies, Corn Flakes, and Frosted Flakes.
Kellogg’s
The question for investors at this point in time is, does Kellogg represent a reasonable potential investment return, including dividends, or should investors be on the lookout for better investment performance somewhere else?
In this article, we will look at Kellogg’s prospects for the next year to try and determine the price direction out to 2024 as compared to the last year.
Kellogg’s Stock Key Metrics
Let’s look at Kellogg’s financial metrics, comparing the latest TTM (Trailing Twelve Months) with the previous year. As might be guessed, there are many differences.
I use the financial metrics to discover what I consider to be positive investment numbers (yellow boxes) and compare them with any negative investment numbers (orange boxes).
Seeking Alpha and author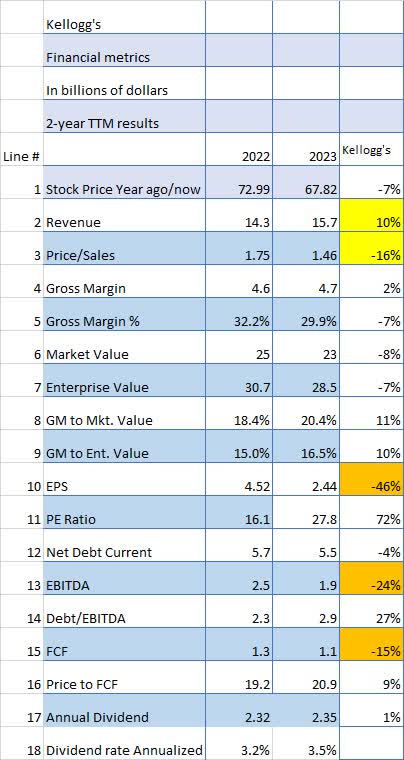
One quick look at the financial metrics table above comparing 2022 TTM to 2023 TTM shows that Kellogg increased Revenue (Line 2) by 10% but nonetheless had lesser EPS (Line 10) down 46%, EBITDA (Line 13) down 24%, and FCF (Line 15) down 15%. This could imply that K had problems with cost containment due to inflation and possibly logistical problems.
Despite those problems, Kellogg’s price (Line 1) decreased by only 7% over the last 12 months in spite of an increase in Revenue (Line 2) of 7%. Gross Margin (Line 4) is also virtually identical 4.6% to 4.7%. This would indicate no improvement in operational efficiency from one year to the next.
The PE Ratio (Line 11) has expanded from 16.1x to 27.8x an increase of 72% on an increase in revenue of only 7%. This could imply Kellogg is considered to be a potential turnaround candidate since the price only dropped 7% in spite of the huge drop in earnings. If K can get the earnings back up to previous years there could be a nice bump in the share price.
Net Debt (Line 12) remained about the same but because the EBITDA dropped by 24% the Debt/EBITDA jumped by 27%.
And even though FCF (Free Cash Flow) on (Line 15) dropped by 15%, the Price to FCF ratio (Line 16) only dropped by 9% which is another turnaround indicator assuming management can return this year’s FCF to the previous year’s level or higher.
So Kellogg had poor results over the last 12 months although the share price drop was not in line with the drop in earnings, EBITDA, and FCF indicating that the price may have a nice bump upwards if K can at least return to last year’s levels.
What Do Analysts Think Of Kellogg?
Wall Street and Seeking Alpha analysts are decidedly neutral about Kellogg with 3 Buys and 2 Sells. Also, note the large number of Holds (17) relative to Buys and Sells. Not much enthusiasm for Kellogg’s from analysts.
Seeking Alpha and author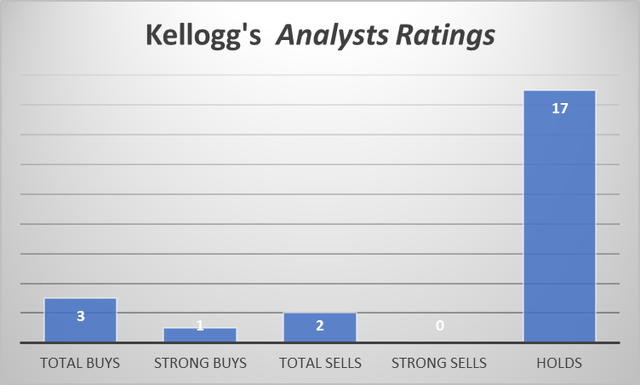
The quant rating has been very consistent in the last year with a Hold rating for the entire twelve-month period.
Seeking Alpha
All in all, Kellogg’s appears to have a rather blah rating from everyone.
MarketWatch analysts also have a Hold rating across the board.
MarketWatch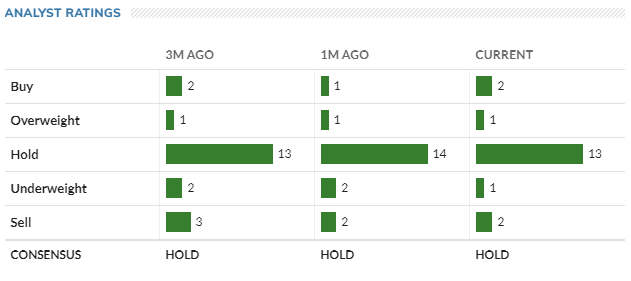
So based on the above ratings Kellogg seems to be a Hold.
How Does Kellogg’s Price Compare To Other Companies In Its Market Sector?
A legitimate question when looking at any stock is to compare its performance with other stocks in the same market sector. If we look at Kellogg’s performance over the last year and compare it to other stocks in the food production sector, we can see Kellogg has performed about in line with the others.
In the following chart, we can see that Kellogg has performed about in line with other companies (down 4%) in the food production sector, such as Kraft Heinz (KHC) down 4%, and General Mills (GIS) up 1%.
Seeking Alpha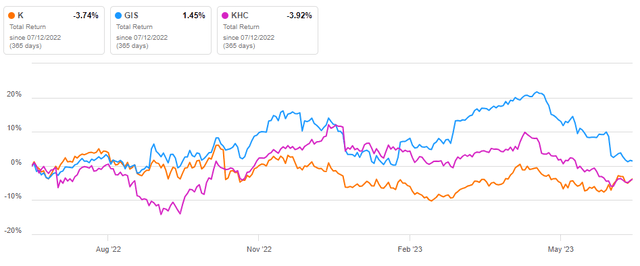
This would imply the food production sector, in general, is underperforming the market. Questions concerning inflation certainly have to have had an effect on the food production sector as prices of certain raw materials items have increased significantly in price.
Kellogg’s Dividend, Free Cash Flow and Share Buybacks
Kellogg has increased their dividend for 18 consecutive years, an enviable record.
However, K’s rate of dividend growth has been meager, as shown by the following 3, 5, and 10-year comparisons.
Seeking Alpha
Kellogg Dividend to FCF ratio over the last 10 years shows the last 3 years have been reasonable with a range of 53% to 69%.
Seeking Alpha and author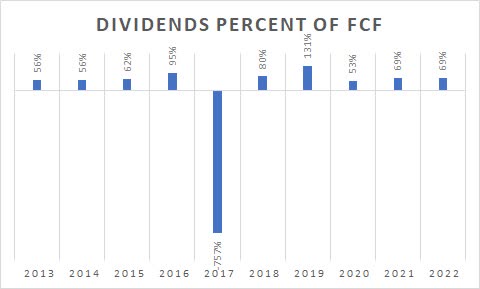
Kellogg has also bought back approximately 5% of its shares over the last 10 years.
Seeking Alpha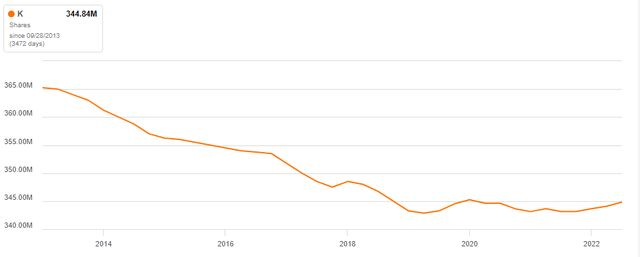
Is Kellogg’s Stock A Buy, Sell, or Hold?
Obviously, there are risks with a Kellogg’s investment. Besides the day-to-day competitive risks, there are inflation and recession risks. Also, the University of Illinois report showed some concern about lower cereal crop production this year as drought, excessive rains, and war in Ukraine may reduce the harvest significantly. If so, raw material prices will certainly rise forcing K to raise prices.
K’s record on dividends is good but modest. The same could be said for its share buyback record, good but modest.
Note that Kellogg’s price is up 4% in the last month, perhaps a sign that the market thinks K has some turnaround potential.
Seeking Alpha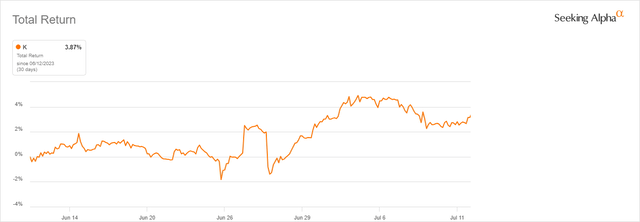
One other positive point is Kellogg’s Price to Sales ratio is near an all-time low for the last 10 years.
Seeking Alpha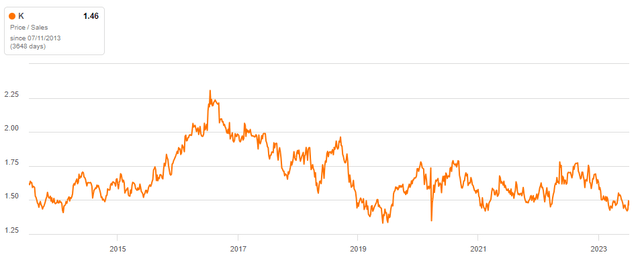
That could be a positive sign for a possible turnaround in the share price if results just improve to last year’s record.
Although there are inklings of potential price improvement over the next year there are still concerns considering how poor last year’s results were.
I rate Kellogg a Hold until we see another quarter or two of improvement.
Read the full article here


