One trend investors have become used to over the last year is the outperformance of mega-cap stocks while seemingly every other stock in the S&P 500 struggles. In the four weeks since the October low on 10/27, though, there has been more uniformity in the gains.
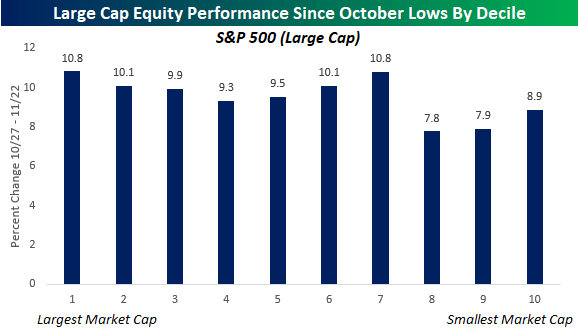
The chart below breaks out the performance of S&P 500 stocks by decile with the largest stocks by market cap in decile one and the smallest in decile ten.
Across the S&P 500, the average performance of stocks in the index is a gain of 9.5% since the 10/27 close, and no decile is outperforming the average gain by more than 1.7 percentage points.
Yes, the decile of the largest stocks is outperforming every other decile (when you look at performance out to two decimal places), but there hasn’t been an overwhelming leader in terms of performance.

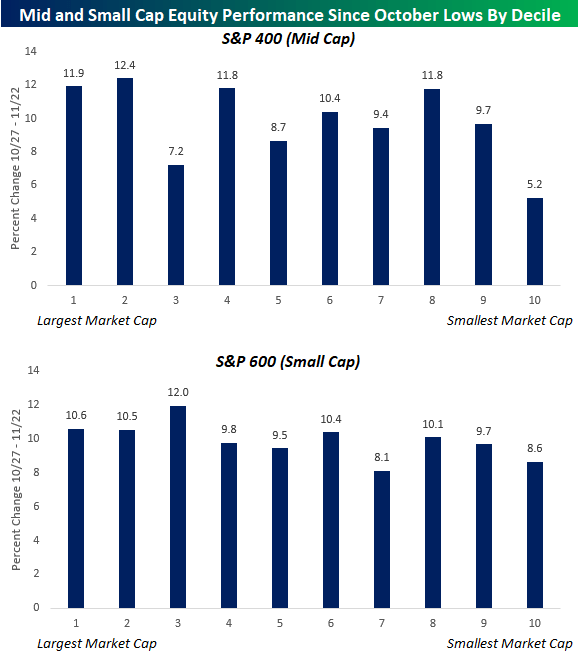
The charts below show the same analysis for mid (S&P 400) and small (S&P 600) cap stocks.
For the S&P 400, while there is a wide disparity between performance across different deciles, outside of the smallest decile also being the decile with the worst average performance, there’s been no correlation between market cap and performance.
Finally, in the small-cap space, there has been even less correlation between performance and market cap as three of the four worst-performing deciles are right in the middle of the pack when it comes to market cap (Deciles 4, 5, and 7). Are the days of simply buying the largest stocks and watching them trounce the rest of the market numbered?

Original Post
Editor’s Note: The summary bullets for this article were chosen by Seeking Alpha editors.
Read the full article here


