What is innovation? Simply put, innovation can be thought of as devising new products or technologies that create value for customers. Historically, innovative companies have richly rewarded their shareholders. For example, Apple Inc. (AAPL) revolutionized mobile phones with the introduction of the iPhone in January 2007 and investors have enjoyed a 70x return on their AAPL shares since.
The Direxion Moonshot Innovators ETF (NYSEARCA:MOON) claims to give investors exposure to the 50 most ‘innovative’ companies in the S&P 500 in hopes of finding the next Apple.
However, after reviewing the ETF’s construction and index methodology, I have serious reservations about the MOON ETF. I do not believe counting keywords and calculating R&D expenses relative to revenues adequately captures the ‘essence’ of innovation. The ETF’s poor performance also suggests the methodology is flawed. I recommend investors avoid the MOON ETF.
Fund Overview
The Direxion Moonshot Innovators ETF gives investors exposure to the 50 most innovative US companies as identified by the index provider. The MOON ETF tracks the S&P Kensho Moonshots Index (“Index”), an index that selects 50 companies deemed to have the highest ‘Early-Stage Composite Innovation Scores’ in the S&P 500.
The MOON ETF has $32 million in assets and charges a 0.65% net expense ratio.
Strategy
The Early-Stage Composite Innovation Score is based on a company’s Allocation to Innovation Score and Innovation Sentiment Score. The Allocation to Innovation Score is a ranking based on a company’s allocation to research and development (“R&D”) expenses relative to revenues compared to other companies in the same industry. The Innovation Sentiment Score is calculated from a review of a company’s regulatory filings in the past year for the use of ‘words related to innovation’.
Seriously Flawed Methodology
Taking a step back and thinking about the Moonshot index’s strategy, I worry that the methodology is seriously flawed. The Allocation to Innovation Score is biased towards early stage companies with low revenues compared to R&D expenses. Moreover, it is only concerned about the amount of R&D spending relative to revenues and not the effectiveness of that R&D spending. Finally, it assumes that a high R&D expenses / revenues ratio will lead to stock outperformance.
Next, the Innovation Sentiment Score is laughably simplistic. The index literally counts the number of times certain keywords appear in a company’s filings and compares it to peers (Figure 1).
Figure 1 – Innovative Sentiment Score is overly simplistic (spglobal.com)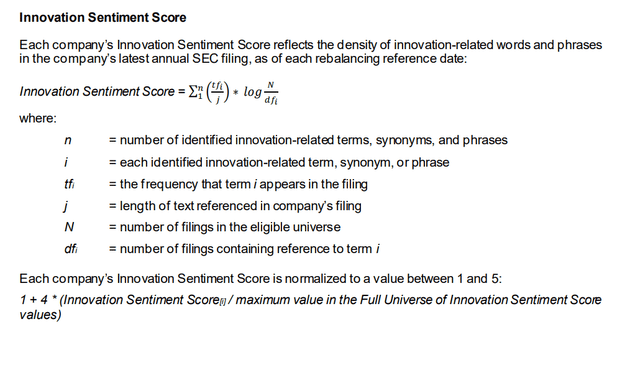
To game this algorithm, a company simply needs to pepper its regulatory filings with keywords and jargon suggesting it is an innovative company. An illustrative list of keywords is shown in Figure 2. Notice these keywords do not convey any real insight on the company’s innovations. I also aspire to inspire readers by disrupting how research articles are written using innovative and groundbreaking analysis and original imaginative ideas. That does not mean I will win a Pulitzer.
Figure 2 – Illustrative list of innovation related keywords (spglobal.com)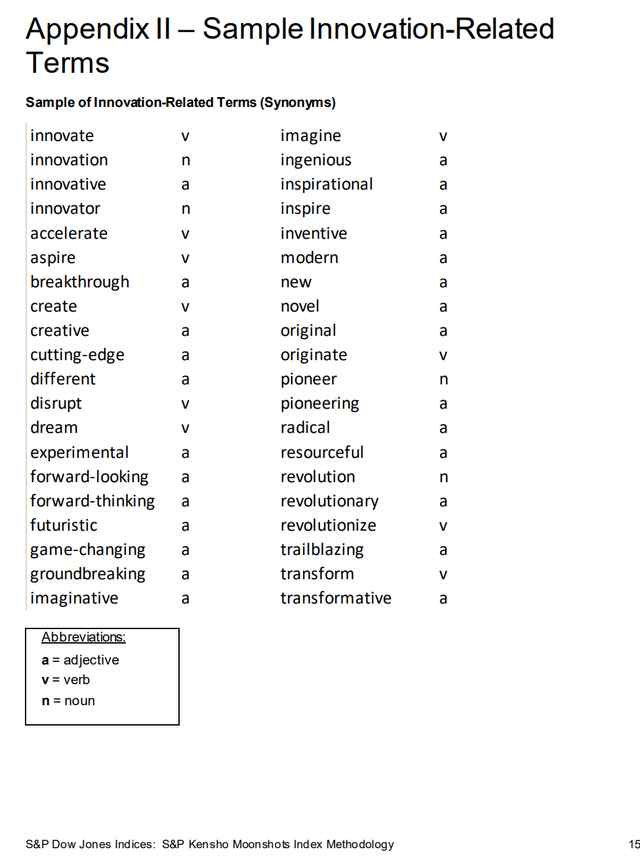
Portfolio Holdings
Figure 3 shows the MOON ETF’s top 10 holdings and index sector weights. The MOON ETF does have large weightings in innovation-related sectors like Information Technology (44.9% of portfolio) and Health Care (22.2%), particularly biotech.
Figure 3 – MOON ETF top 10 holdings and sector allocation (direxion.com)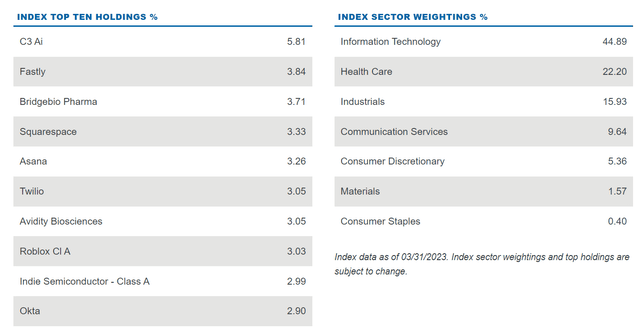
Unfortunately, it is difficult to assess whether these are truly the most ‘innovative’ companies within the S&P 500 Index. For example, the ETF’s top holding is C3.ai (AI), a supposed ‘leader’ in ‘artificial intelligence’ (“AI”) technologies. However, Wall Street analysts are cautious on the company due to “skepticism on the true differentiation of the company’s platform, its traction with customers or its ability to hit its constantly evolving financial targets”.
For leadership in AI, most analysts commonly agree that the current leaders are Nvidia (NVDA), Microsoft (MSFT) and Alphabet (GOOGL), but none of these innovative companies qualify for the Moonshot Index because they generate too much revenue relative to their R&D expenses.
Returns
Figure 4 shows the historical returns of the MOON ETF. The MOON ETF was incepted in November 2020 and its performance has been poor since inception, as many of its constituents were decimated in the 2021-2022 bear market. The ETF has an average annual return of -24.7% since inception to May 31, 2023.
Figure 4 – MOON ETF historical returns (morningstar.com)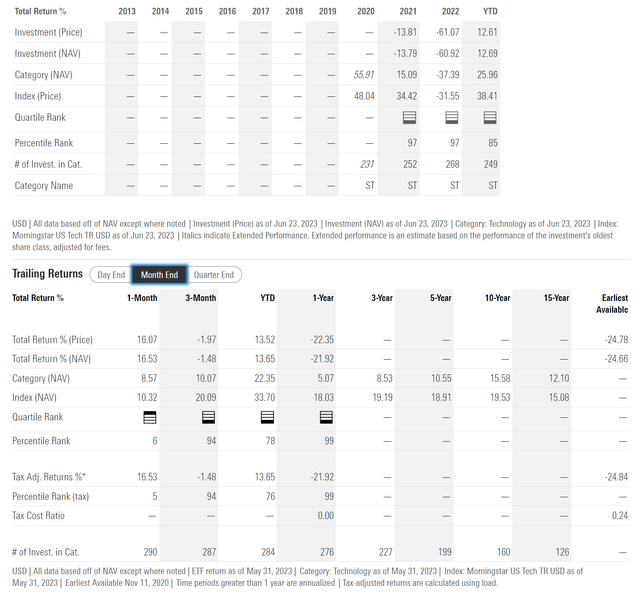
Over the long-term, the MOON ETF’s underlying index has performed a little better. The S&P Kensho Moonshots Index has delivered 5Yr annualized returns of 1.7% to May 31, 2023 (Figure 5).
Figure 5 – Moonshot index historical returns (spglobal.com)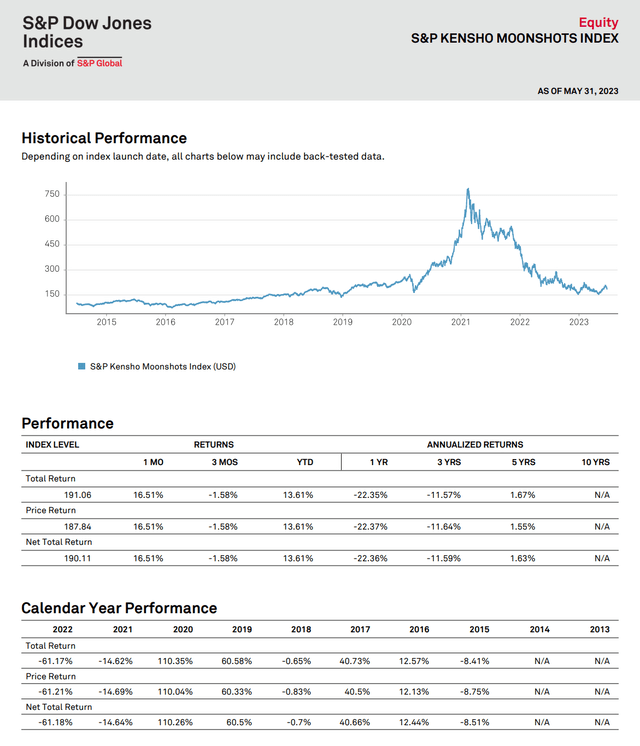
There was a notable rally from 2020 to early 2021 when the index almost quintupled, as investors chased profitless growth stocks. However, over the long run, the index appears to be a dud, with long-term returns far below broader ‘growth’ indices like the Nasdaq 100 Index, which has delivered far superior returns, as modeled by the Invesco QQQ Trust ETF (QQQ) (Figure 6).
Figure 6 – QQQ historical returns (morningstar.com)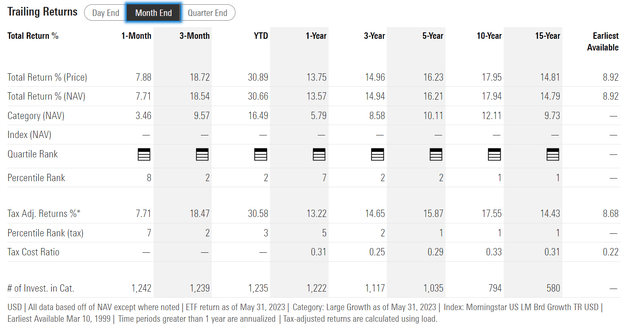
Conclusion
The MOON ETF claims to provide investors with exposure to the most innovative companies in the S&P 500. However, innovation is an extremely difficult concept to ‘measure’. I believe the MOON ETF’s methodology of counting keywords and calculating R&D expenses to revenues does not adequately capture what is true ‘innovation’. The boom-bust nature of the underlying index suggest this is one ETF to be avoided.
Read the full article here


