


Quality Stocks
May was not a great month for my watchlist as the 15 chosen stocks from last month collectively fell by 5.09%. This was grossly worse than the SPDR S&P 500 Trust ETF (SPY) that posted a gain of 0.46%. And even Vanguard’s Dividend Appreciation ETF (VIG) managed to offer a superior return, posting a loss of 2.74%. Year-to-date my watchlist is still in the green, up 3.28%, compared to a gain of 1.42% for VIG and 9.69% for SPY.
Following May, the watchlist sees its long-term annualized return decrease to 11.31%, once again falling below my long term target of 12%. This isn’t the first time the long term return dipped below 12% and I remain optimistic that it will exceed my target in the future.
The main focus of this watchlist is to find the best combination of quality companies trading for attractive prices. I believe this is the optimal long-term strategy to building wealth.
The top 15 dividend growth stocks for June offer an average dividend yield of 1.56%. Collectively, they have increased dividend payments at a rate of 29.33% during the last 5 years. Based on dividend yield theory, these 15 stocks are about 36% undervalued right now, and I think they are poised to offer strong long-term returns.
I would recommend two approaches to dividend investing. The first is to dollar-cost average into at least 10-20 or more quality dividend-paying stocks across multiple sectors and industries. By dollar-cost averaging, you eliminate the risk of trying to value a stock and over a long enough period, theoretically, you will buy shares at market highs, lows, and in-between resulting in an average cost basis somewhere in the middle. The second method carries a little more risk. Invest in undervalued stocks, also dollar-cost averaging into at least 10-20 unique quality companies across multiple sectors and industries. The additional risk with this approach comes from the chance that your valuation method proves to be incorrect. However, by investing in multiple unique stocks, the odds that you accurately identify at least a few undervalued stocks increases. The resulting upside from a few correct picks may more than offset the underperformance from the bad ones.
Watchlist Criteria
The criteria used to determine which stocks are included in my high-growth dividend stock watchlist remains unchanged for June 2023. It is made up of the 8 factors listed below that have historically outperformed the broad universe of dividend-paying stocks when analyzed collectively.
- Market Cap of at least $10 billion.
- Payout Ratio no greater than 70%.
- 5-year Dividend Growth rate of at least 5%.
- 5-year Revenue Growth rate of at least 2%.
- 5-year EPS Growth rate of at least 2%.
- S&P Earnings and Dividend Rating of B+ or better.
- Wide or Narrow Moat (Morningstar).
- Exemplary or Standard Management Team (Morningstar).
The rules identified 133 stocks for the month that were all ranked based on the above-mentioned metrics with the exclusion of market cap. I then computed the current valuation for each stock using dividend yield theory. All stocks were ranked for both quality and valuation and sorted by the best combination of both. Next, I computed a forecasted rate of return for the next 5-year period for each of the stocks. This return is based on forecasted earnings growth, a return to fair value and the dividend yield.
The highest ranked 15 stocks with a forecasted return greater than or equal to 12% were chosen for the watchlist. The long-term hypothesis for this watchlist is that it will outperform a broad quality dividend fund such as Vanguard’s Dividend Appreciation ETF, VIG.
Watchlist For June 2023
Created by Author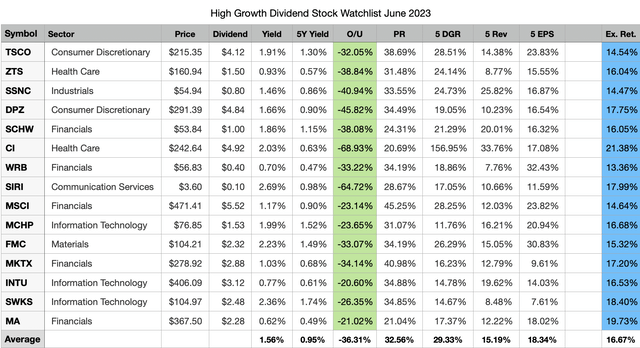
Above are the 15 stocks I am considering for further evaluation during the month. They are sorted in descending order by their rank and 5-year dividend growth rate.
The “O/U” column represents potential undervalue; this is a comparison of the current dividend yield to the historical dividend yield as a function of share price.
The expected return in the table above was computed using a discounted 5-year EPS forecast, a return to fair value and the current dividend yield. There is also a margin of safety built into the forecasted return. These figures are just assumptions based on the available data and there is no guarantee these returns will be attained.
The large potential under-valuation for Cigna (CI) is overstated due to very fast recent dividend growth by the company. Dividend yield theory works best for companies with stable and consistent dividend growth. Cigna’s potential undervaluation has been dropping every month as the trailing dividend yield catchups up to its current yield but it will take at least a few more months before it looks reasonable.
There are 5 changes to the top 15 list from the prior month. CDW (CDW), Lowe’s (LOW), Monolithic Power Systems (MPWR), Sherwin-Williams (SHW) and Visa (V) have fallen further down the list, or do not meet the 12% expected rate of return threshold and were replaced by Intuit (INTU), Mastercard (MA), Microchip Technology Inc. (MCHP), Sirius XM Holdings (SIRI) and Skyworks Solutions (SWKS).
Past Performance
The top 15 list for May posted a loss of 5.09% but continues to maintain its long-term alpha over both benchmarks. The long-term annualized rate of return for the watchlist decreases from 13.89% last month to 11.31%. My target rate of return is 12%, and despite the volatility in the market this year I remain optimistic that this watchlist will continue to exceed this goal in the long run.
|
Month |
Top 15 |
All |
VIG |
SPY |
|
1 Month |
-5.09% |
-3.38% |
-2.74% |
0.46% |
|
3 Month |
-2.76% |
-2.91% |
1.34% |
5.85% |
|
6 Month |
-2.10% |
-3.45% |
-2.36% |
3.37% |
|
1 Year |
4.45% |
0.07% |
1.75% |
2.92% |
|
2020 |
6.27% |
6.15% |
9.09% |
7.94% |
|
2021 |
33.81% |
31.55% |
23.75% |
28.76% |
|
2022 |
-8.58% |
-15.12% |
-9.80% |
-18.16% |
|
2023 |
3.28% |
2.24% |
1.42% |
9.69% |
|
Since Inception |
34.27% |
21.19% |
23.51% |
24.76% |
|
Annualized |
11.31% |
7.24% |
7.98% |
8.38% |
Top 5 past and present watchlist stocks in May 2023:
- Nvidia (NVDA) +36.34%
- Applied Materials (AMAT) +18.24%
- Lam Research (LRCX) +17.67%
- KLA Corporation (KLAC) +14.99%
- Accenture (ACN) +9.14%
None of the top 15 stocks selected in May was amongst the top 5 past and present performing stocks last month. May was the “semiconductor” show as Nvidia posted great earnings and an even better outlook driving all semiconductor companies to higher valuations. In total there have been 69 unique dividend stocks selected by this watchlist since September of 2020.
Top 5 Stocks by Total Return since joining the watchlist:
- Nvidia (NVDA) +184.61% (26 months)
- Automatic Data Processing (ADP) +58.83% (33 months)
- Tractor Supply (TSCO) +53.63% (28 months)
- Cintas (CTAS) +52.08% (28 months)
- United Healthcare (UNH) +50.56% (28 months)
Since not all stocks have been on the watchlist for the full 33 months of its existence, comparing a monthly average return can help normalize the results. Here are the top 5 stocks with the highest average monthly return since joining the watchlist.
- Nvidia (NVDA) +4.10% (26 months)
- Rollins (ROL) +1.65% (16 months)
- Tractor Supply (TSCO) +1.55% (28 months)
- Cintas (CTAS) +1.51% (28 months)
- KLA Corporation (KLAC) +1.48% (25 months)
Drivers Of Alpha
The watchlist underperformed VIG in May. 5 watchlist stocks outpaced the ETF last month.
- (MPWR) +6.05%
- (CDW) +1.59%
- (SCHW) +1.39%
- (MSCI) -2.18%
- (CI) -2.32%
The remaining 10 stocks underperformed VIG.
- (LOW) -3.22%
- (SHW) -3.86%
- (V) -4.84%
- (WRB) -5.50%
- (SSNC) -5.77%
- (ZTS) -7.26%
- (DPZ) -8.70%
- (TSCO) -11.66%
- (MKTX) -14.23%
- (FMC) -15.78%
Total Return For All Watchlist Stocks
Here are the total returns for all past and present watchlist stocks since first appearing on the watchlist. Out of the 69 stocks that are on this list, 46 (54 last month) have positive total returns and 23 have negative total returns, the average return is 11.04% (13.69% last month). The watchlist has been around for 33 months, the average duration for all 69 stocks is 25.94 months.
|
Symbol |
Since Joining |
Count |
|
NVDA |
184.61% |
26 |
|
ADP |
58.83% |
33 |
|
TSCO |
53.63% |
28 |
|
CTAS |
52.08% |
28 |
|
UNH |
50.56% |
28 |
|
PGR |
50.10% |
28 |
|
MSFT |
49.17% |
33 |
|
KLAC |
44.52% |
25 |
|
AMAT |
40.82% |
28 |
|
COST |
40.01% |
33 |
|
GGG |
36.18% |
33 |
|
HUM |
34.21% |
27 |
|
CDW |
34.07% |
28 |
|
MPWR |
32.82% |
27 |
|
ACN |
32.40% |
33 |
|
NOC |
32.39% |
33 |
|
LRCX |
30.88% |
28 |
|
ROL |
29.91% |
16 |
|
MSCI |
29.10% |
33 |
|
LMT |
28.49% |
33 |
|
EXPD |
26.69% |
28 |
|
TJX |
24.91% |
28 |
|
APH |
23.59% |
28 |
|
INTU |
23.45% |
33 |
|
BK |
23.42% |
33 |
|
LOW |
22.15% |
33 |
|
WST |
18.59% |
33 |
|
FAST |
18.53% |
33 |
|
BBY |
15.40% |
11 |
|
FDS |
12.55% |
33 |
|
JPM |
12.46% |
28 |
|
BLK |
12.42% |
33 |
|
TMO |
11.89% |
26 |
|
TXN |
11.37% |
28 |
|
MCO |
10.37% |
33 |
|
ROP |
7.97% |
33 |
|
HD |
6.72% |
33 |
|
V |
6.29% |
33 |
|
CI |
6.22% |
15 |
|
SCHW |
5.32% |
28 |
|
MA |
3.43% |
33 |
|
CMCSA |
2.96% |
33 |
|
DE |
2.02% |
18 |
|
SHW |
1.02% |
28 |
|
DG |
0.94% |
26 |
|
FDX |
0.65% |
15 |
|
ICE |
-1.22% |
28 |
|
ZTS |
-1.29% |
4 |
|
EOG |
-3.49% |
3 |
|
MS |
-4.13% |
24 |
|
JKHY |
-4.37% |
33 |
|
NTRS |
-4.96% |
33 |
|
GS |
-9.11% |
22 |
|
WRB |
-10.57% |
2 |
|
ATVI |
-11.53% |
25 |
|
FMC |
-13.44% |
12 |
|
SBUX |
-13.67% |
17 |
|
BX |
-13.71% |
10 |
|
TROW |
-14.67% |
33 |
|
SSNC |
-14.80% |
27 |
|
USB |
-15.69% |
31 |
|
DPZ |
-27.08% |
33 |
|
SWKS |
-31.00% |
17 |
|
LAD |
-39.41% |
26 |
|
SIRI |
-45.03% |
14 |
|
BALL |
-45.80% |
17 |
|
MKTX |
-48.60% |
28 |
|
AAP |
-56.54% |
11 |
|
PARA |
-64.07% |
23 |
Dividend Analysis for New Stocks
Below are a 7 year dividend yield theory chart, a dividend history chart and dividend growth table for the 5 new stocks on the watchlist this month.
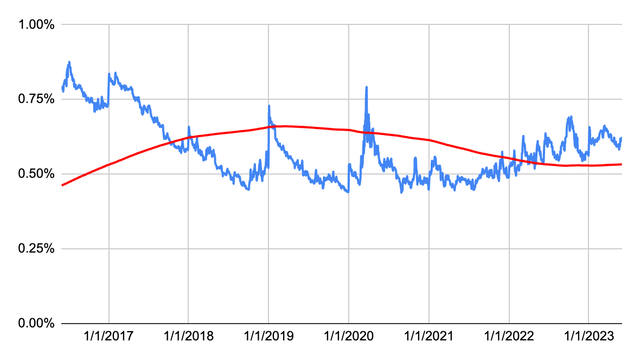
First up is Intuit.
Created by Author Created by Author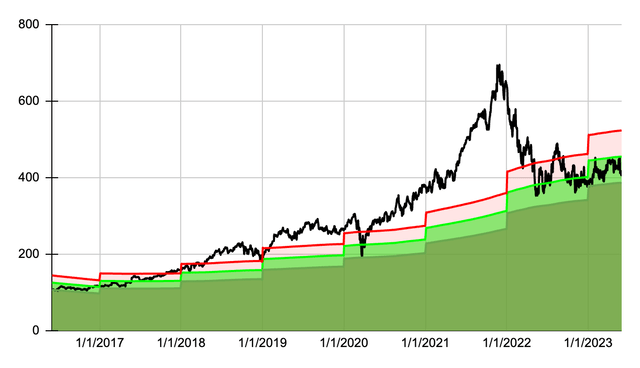
| Year | Dividend | Growth | CAGR |
| 2023 | 3.12 | 10.64% | |
| 2022 | 2.82 | 15.10% | 10.64% |
| 2021 | 2.45 | 12.39% | 12.85% |
| 2020 | 2.18 | 12.37% | 12.69% |
| 2019 | 1.94 | 18.29% | 12.61% |
| 2018 | 1.64 | 16.31% | 13.73% |
| 2017 | 1.41 | 13.71% | 14.15% |
| 2016 | 1.24 | 18.10% | 14.09% |
| 2015 | 1.05 | 28.05% | 14.58% |
| 2014 | 0.82 | 17.14% | 16.01% |
| 2013 | 0.70 | 12.90% | 16.12% |
| 2012 | 0.62 | 313.33% | 15.82% |
| 2011 | 0.15 | 28.78% |
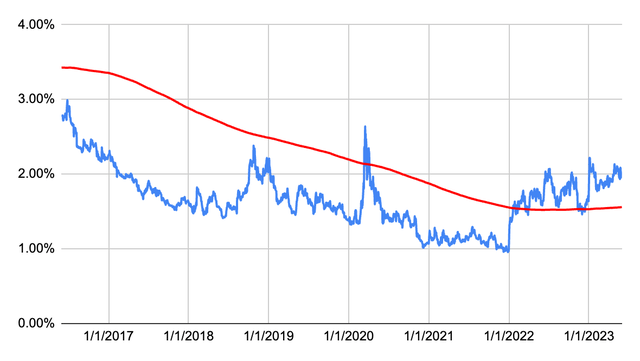
Here is Mastercard.
Created by Authord Created by Author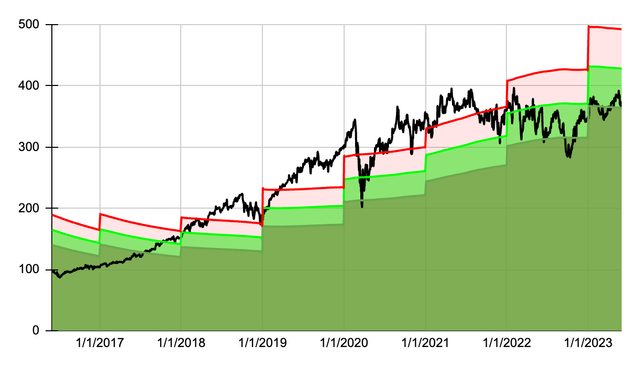
| Year | Dividend | Growth | CAGR |
| 2023 | 2.28 | 16.33% | |
| 2022 | 1.96 | 11.36% | 16.33% |
| 2021 | 1.76 | 10.00% | 13.82% |
| 2020 | 1.60 | 21.21% | 12.53% |
| 2019 | 1.32 | 32.00% | 14.64% |
| 2018 | 1.00 | 13.64% | 17.92% |
| 2017 | 0.88 | 15.79% | 17.19% |
| 2016 | 0.76 | 18.75% | 16.99% |
| 2015 | 0.64 | 45.45% | 17.21% |
| 2014 | 0.44 | 109.52% | 20.06% |
| 2013 | 0.21 | 100.00% | 26.93% |
| 2012 | 0.11 | 75.00% | 32.29% |
| 2011 | 0.06 | 35.41% |
Here is Microchip Technology Inc.
Created by Author Created by Author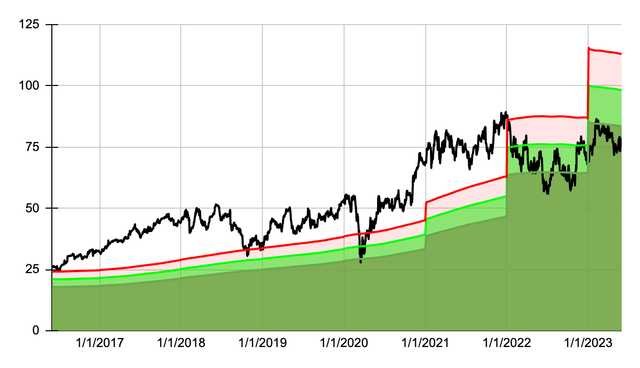
| Year | Dividend | Growth | CAGR |
| 2023 | 1.53 | 32.12% | |
| 2022 | 1.16 | 35.92% | 32.12% |
| 2021 | 0.85 | 15.84% | 34.01% |
| 2020 | 0.74 | 0.55% | 27.65% |
| 2019 | 0.73 | 0.55% | 20.26% |
| 2018 | 0.73 | 0.55% | 16.03% |
| 2017 | 0.72 | 0.56% | 13.29% |
| 2016 | 0.72 | 0.56% | 11.38% |
| 2015 | 0.72 | 0.56% | 9.97% |
| 2014 | 0.71 | 0.57% | 8.88% |
| 2013 | 0.71 | 0.93% | 8.02% |
| 2012 | 0.70 | 34.68% | 7.35% |
| 2011 | 0.52 | 9.40% |
Here is Sirius XM Holdings.
Created by Author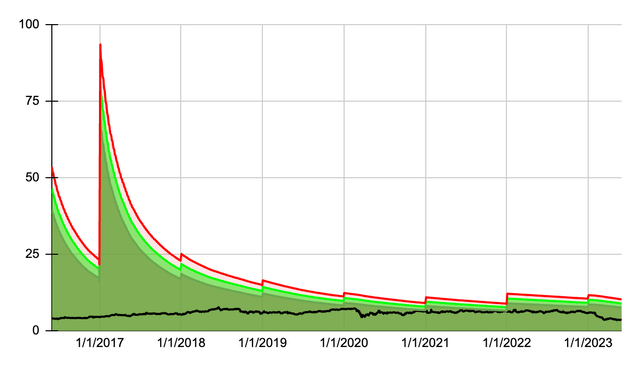
Unfortunately the chart looks a bit goofy as SIRI doesn’t have a long enough dividend history to properly utilize dividend yield theory for 7 years.
Created by Author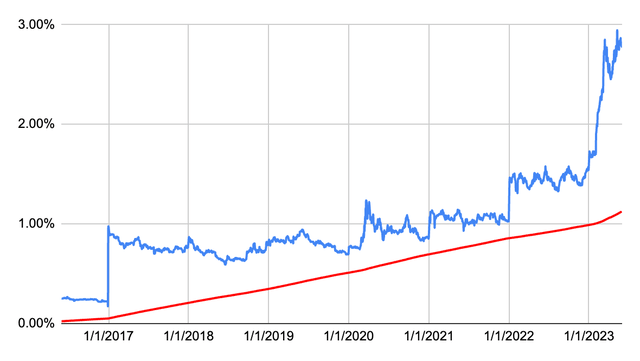
| Year | Dividend | Growth | CAGR |
| 2023 | 0.10 | 11.11% | |
| 2022 | 0.09 | 36.57% | 11.11% |
| 2021 | 0.07 | 20.70% | 23.18% |
| 2020 | 0.05 | 10.08% | 22.35% |
| 2019 | 0.05 | 9.98% | 19.16% |
| 2018 | 0.05 | 10.00% | 17.26% |
| 2017 | 0.04 | 310.00% | 16.02% |
| 2016 | 0.01 | 38.95% |
Here is Skyworks Solutions.
Created by Author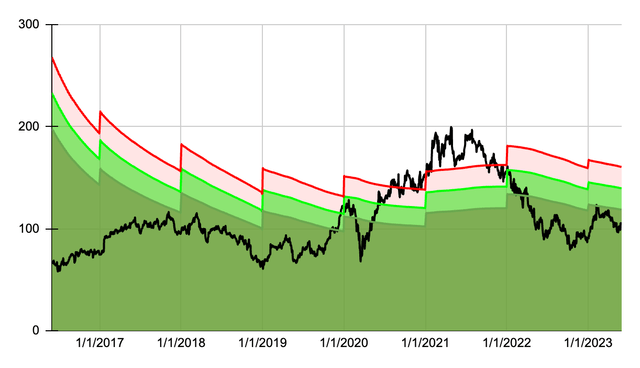
Skyworks also does not have 12 years of dividend history so the initial valuations on the left side of the chart are not accurate.
Created by Author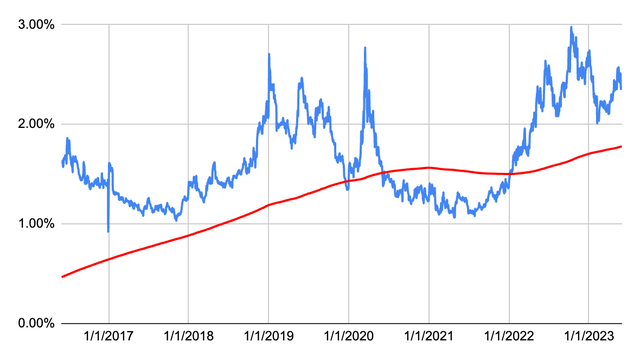
| Year | Dividend | Growth | CAGR |
| 2023 | 2.48 | 5.08% | |
| 2022 | 2.36 | 11.32% | 5.08% |
| 2021 | 2.12 | 12.77% | 8.16% |
| 2020 | 1.88 | 14.63% | 9.67% |
| 2019 | 1.64 | 17.14% | 10.89% |
| 2018 | 1.40 | 16.67% | 12.12% |
| 2017 | 1.20 | 11.11% | 12.86% |
| 2016 | 1.08 | 38.46% | 12.61% |
| 2015 | 0.78 | 122.86% | 15.56% |
| 2014 | 0.35 | 24.30% |
Read the full article here