


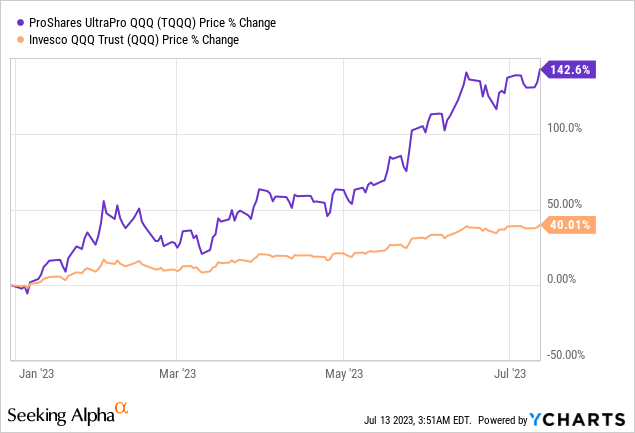
In 2023, Invesco QQQ Trust ETF (NASDAQ:QQQ) exhibited extreme volatility, while triple-leveraged ProShares UltraPro QQQ ETF (NASDAQ:TQQQ) exhibited substantial movement. While QQQ can be included in a long-term portfolio, TQQQ should be actively managed due to its susceptibility to volatility. And in my opinion, the time has come for a tactical move – selling the leveraged ETF due to the significantly increased probability of higher drawdowns. I will provide the macro outlook as well as some calculations as to why the current environment and current returns pose a significant threat to future returns, and from this vantage point, it does not make sense to be long because the risks outweigh the potential reward in the medium-term.
The best year ever
The Nasdaq 100 Futures (NDX:IND) and QQQ appreciated close to 40% in 2023 by early July, whereas many anticipated a price correction at the beginning of the year. This analysis sought to take a slightly more statistical approach while examining additional potential drivers that could support the bearish thesis. As previously mentioned, rebalancing or recognizing when to exit the market is essential to achieving success with leveraged ETFs. I am convinced that the time has come. Using the FRED dataset and data from 1985 to calculate Nasdaq performance, we can conclude that this is the best year-to-date performance (in the dataset). In addition, I have highlighted the two best and two worst years in the dataset.
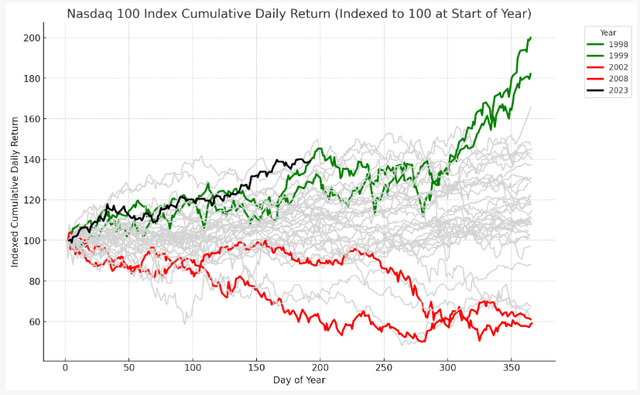
Nasdaq´s track on its record (Author, calculation via ChatGPT)
I have also examined previous years, where Nasdaq YTD June returns ranged from 30% to 40%. 1987, 1995, 1998, and 2023 were the years in the matter. I’m interested in how the Nasdaq has evolved during these years with comparable returns. For example, July to December returns in 1987 were extremely negative. However, while there have only been three similar occurrences in the past, since July two of them have experienced drawdowns of more than 15%. It would be greater than -30% for TQQQ, and possibly even more if a drawdown of greater magnitude occurs. From this perspective, the risk-to-reward ratio does not favor a bullish scenario at present. On the other hand, returns in 1995 remained solid, and the final quarter of 1998 was exceptionally robust. However, keep in mind that 2023 will be different, as this is merely history, but it is always useful to know how the market evolved during similar conditions.
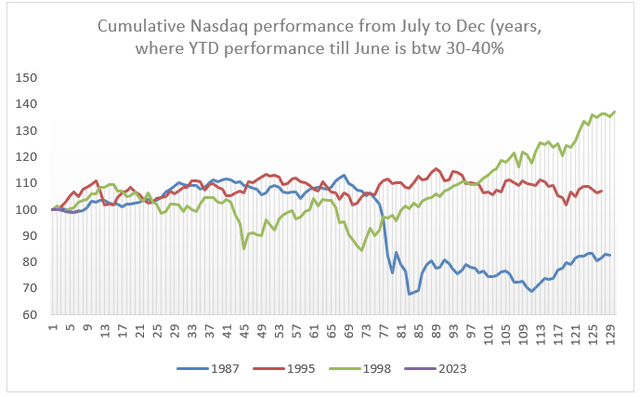
Cumulative Nasdaq performance from July to Dec, when YTD performance till June is i. 30-40% (Author´s calculation.)
History as a guide
The most aggressive tightening cycle
This is nearly the most aggressive cycle of monetary tightening ever. It was so until the “skip” in June. This aggressive stance can have significant ramifications, and I believe it will be sufficient to reduce inflationary pressures. But there is also the possibility of system tail-event. It has already occurred, as I elaborated on in the previous analysis. While the support was not QE, but rather expensive loans, it was still assistance from the central bank. Without this, the regional banking system would likely have collapsed due to contagion.
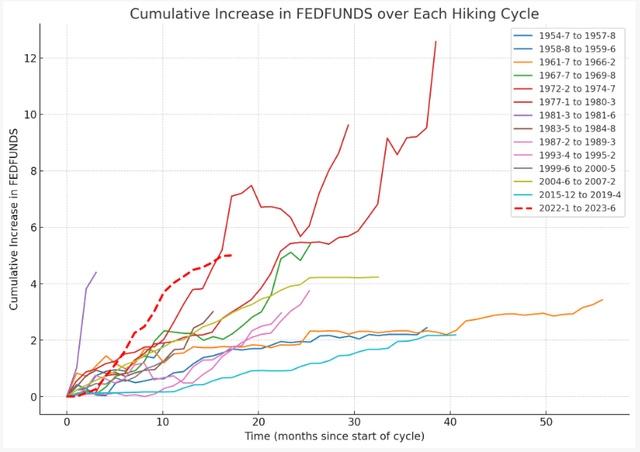
Cumulative increase in FEDFUNDS over each hiking cycle (Author, calculation via ChatGPT.)
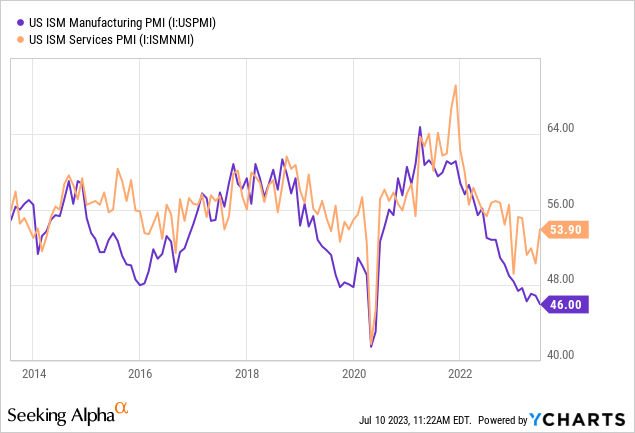
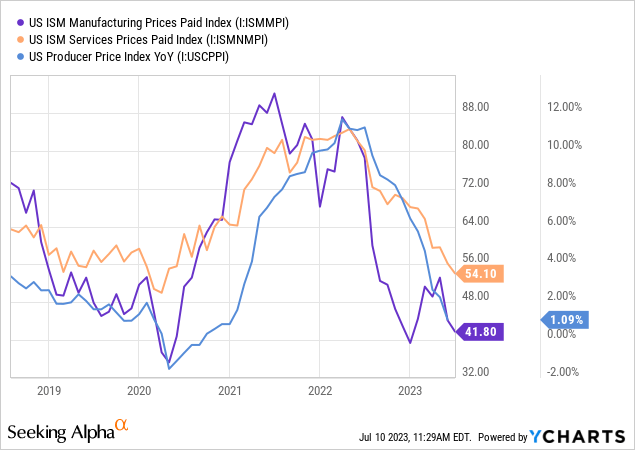
I do not know if the market or economy will be able to handle it in the future without further damage, but the likelihood of something breaking increases with each additional increase. One thing is certain, and that is that inflation will decline. Due to the fact that many leading indicators declined significantly. However, one of the reasons why a recession is not imminent is due to the resilience of the service sector, which is currently able to withstand the aggressive hiking cycle. In ISM Manufacturing, however, the story is different and things are not going well.
If you want to know why I believe inflation is declining, you should read my previous article; however, it is driven primarily by the results of leading indicators. However, wage pressures persist because employees are negotiating wages with a lag. With still-rising borrowing costs and weakening demand, it will likely be difficult to increase earnings. However, major corporations such as Apple (AAPL), Microsoft (MSFT), Alphabet (GOOGL), Meta (META), and NVIDIA (NVDA) are unlikely to experience a decline. Nonetheless, despite all the AI narratives, the demand pressures may also surprise them.
Hiking cycle as a friend
Below, you can view the evolution of the Nasdaq 100’s returns throughout the various hiking cycles. Maybe it comes as a bit of a surprise to you, but when the Fed initiated a cycle of rate hikes, the Nasdaq has typically experienced rapid growth. 2022-2023 was the only exception.
If you want a more comprehensive view of each cycle, however, I’ve highlighted it in the various cycles and Nasdaq returns. Although it is not entirely straightforward, there are recurring patterns. In the first 10 to 15 months following the initial tightening in 1986, 1993, 2004 and 2022, the Nasdaq experienced a substantial bearish rally. The cycles of 1999 and 2015 are the exceptions. However, if the tightening continued, the stock market tended to recover, just as it did in 2023. It appears that initially the market was fearful of the tightening and its potential economic repercussions, but the narrative changed. Until rates are being cut as a result of policy error.
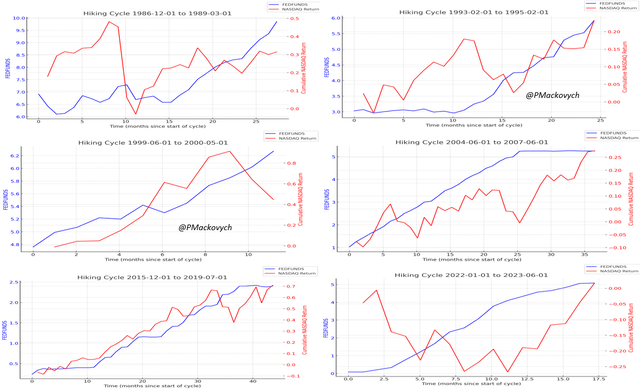
Hiking cycles – Fed Funds vs. Nasdaq (Author, calculation via ChatGPT)
Monetary easing as a threat
The real party started when the Fed was done hiking rates. Many times, it led to a policy error or an important and fast reaction to something possibly broken in the economy—the reaction to recession or crisis fears. It’s important to examine in which phases we are now; that´s the million-dollar question. However, based on my current knowledge, I see it similarly to the market: that we are done with hiking. There may be one or two small hikes, but inflation will go down quite fast (if the labor market is not so tight and there are no such high wage pressures). And also because of the base effect. So from this point of view, I believe we are nearing the end of the monetary cycle, and while the Fed expects rates to be elevated for the next few years, FOMC projections are lower compared to the current rate environment. However, a specific correlation between cuts and Nasdaq development can be confirmed only during fast easing as a prompt reaction. When rates are flat and low for a longer period, there´s a massive opportunity for riskier assets.
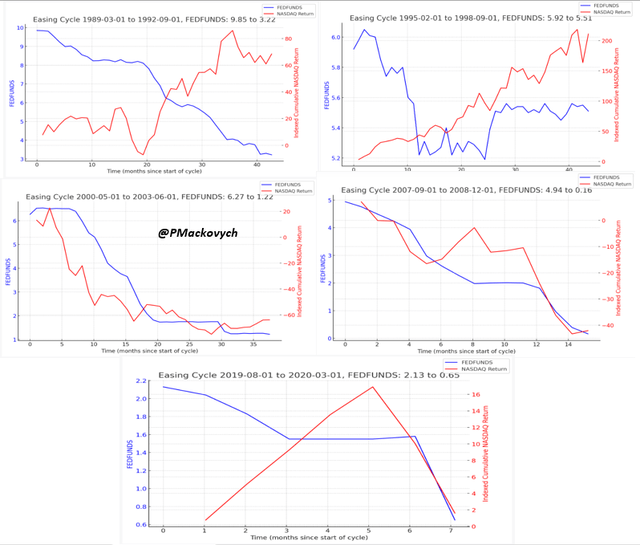
Easing cycles – Fed Funds vs. Nasdaq (Author, calculation via ChatGPT.)
However, historical data for the Nasdaq dataset and its correlation with a decrease in the Fed Funds Rate is limited; it merely suggests that a decline is more likely when monetary policy is beginning to be loosened. With the exception of the cycle from 1995 to 1998, every cycle in the dataset is associated with downward price pressures in the first ten months. While the dataset is limited due to the absence of Nasdaq data, it is important to note that when the Fed Funds top is established, it is surprisingly risky to hold long positions. Despite the fact that history does not repeat itself but rather rhymes, I believe it can serve as a useful guide for us. However, there is also a possibility of a rally, as observed during the bullish cycle during the period of monetary easing from 1995 to 1998. It is much more complicated than simply examining previous cycles to analyze a number of factors.
The real yields narrative and why it has changed
As can be seen in the chart below (inverted real yields and Nasdaq), many investors are discussing a single chart: the disparity between real yields and risk assets, such as the technology sector. However, they are only concerned with the development of 2021 and beyond. While I believe that a decline in real yields should be more closely associated with market rallies and vice versa, an increase in real yields should indicate greater pressures on risky assets. However, what does history say about this?
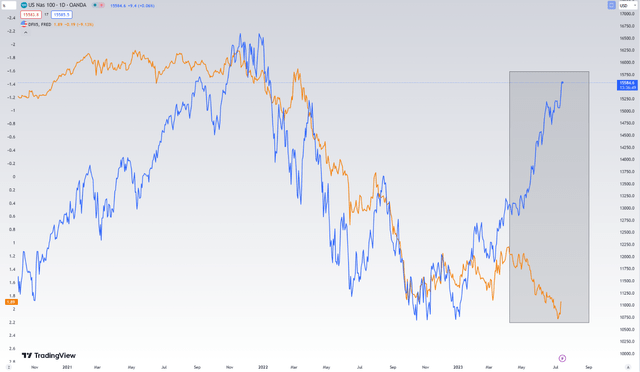
5-year TIPS yield vs. Nasdaq (Author via Tradingview)
I make an effort to compare the evolution of 5-year TIPS yield (real yield) and Wilshire 5000 (WIVX) over the past five cycles. Perhaps you are wondering why. I utilized Wilshire 5000 data due to its data availability. It should not, however, change the thesis. I intend to imply that we can examine the development of real yields and the Wilshire 5000 over the course of the previous five cycles. Rather than focusing solely on fed funds rates, it may be preferable to emphasize the bigger picture.
In the first three cycles, there was a strong positive correlation, meaning that Wilshire 5000 and TIPS yields moved in tandem in a positive direction. In general, the index increased when TIPS yields increased. However, there were also some occurrences and divergences as seen in late 2023. In contrast, the correlation was strongly positive for the first three cycles and strongly negative for the most recent two. Even the linear regression of each cycle exhibited substantial variability.
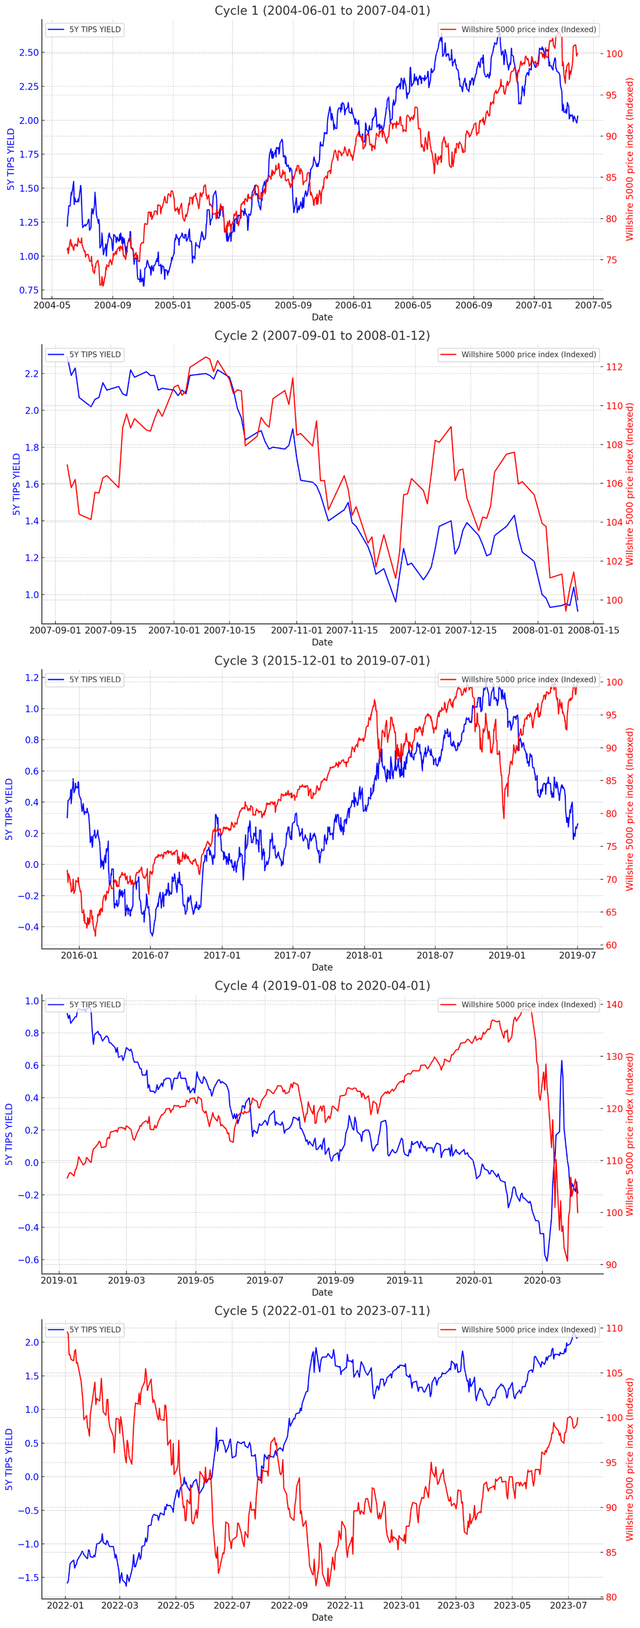
The relationship via 5Y TIPS yield and Wilshire 5000 in cycles (Author, calculations via ChatGPT.)
The first significant discrepancy began at the end of the third cycle in 2019, when the correlation started to be negative. This trend continued in the fourth cycle, and by the end of the fifth cycle in 2022, the correlation was once again positive. This table displays the correlation between each cycle:
| Cycle | Correlation |
| 1st cycle | 0.83 |
| 2nd cycle | 0.75 |
| 3rd cycle | 0.73 |
| 4th cycle | -0.33 |
| 5th cycle | -0.63 |
There are numerous factors that must be considered, such as the EPS trend, the change in monetary policy, and others, such as sentiment, put-call option volume, and greed. As a reminder, however, banking issues began to evolve in March, and this could be the first step toward restoring this correlation to pre-2019 levels (in the aforementioned cycles). Because the Fed did not assist with additional free liquidity, similar to QE, but rather with loans. I believe the central bank has begun to return to a period of normalization of monetary policy; this could be a narrative-altering event. If this is what we account for in the thesis, the change to positive correlation between returns and real yields in the medium-run (where discrepancies can also occur), then the forward estimation of real yield is crucial for the medium- to long-run.
Nonetheless, at this point in July 2023, I believe that the market is more focused on improved future EPS expectations in the technology sector, which could be the primary driver of price increases. Because, if the market were to focus on the development of real yields, the most recent quarter should have witnessed the opposite movement (due to a negative correlation) based on the previous two cycles. The third implication that makes sense to me would be a rapid decline in inflation expectations, which is not occurring. Real yields are computed by subtracting breakeven rates (annualized inflation expectations) from nominal yields. However, real yields declined slightly, thereby empowering risk assets. The market returned to the negative correlation seen in the previous quarter.
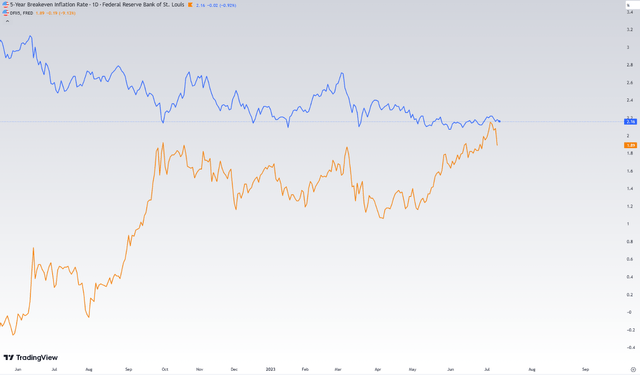
5-year breakeven rates vs. 5-year TIPS yield. (Author via Tradingview)
So, what can we anticipate? Historically, medium-term TIPS yields are significantly above the long-term average and will likely decrease as inflation declines. It would differ from FOMC projections because, according to previously disclosed Fed estimates, they anticipate higher interest rates in 2023, 2024, and 2025. However, the Fed’s dot plot fluctuates quarterly and frequently. In conclusion, I believe it will be bullish for stocks if real yields decline due to the successful achievement of inflation reduction and if EPS is unaffected negatively. Nonetheless, in my opinion, if real yields remain at current levels for an extended period of time, say another three or twelve months, it will be extremely restrictive and could even harm the technology sector. The second possibility is that when real yields decline due to recession fear and policy error, the market will react negatively. This is my long-term perspective on interest rates, real yields, and their potential implications. If real yields remain higher for a longer period of time, I view this as more negative than positive due to my belief that EPS will suffer.
Short-term outlook and seasonality – the worst month ahead
Seasonality is not supportive
There are, in my opinion, two important perspectives that should be connected for a thesis to produce strong outcomes. We determined the medium-term outlook using my rates approach and by navigating upward. I also believe it is crucial to consider seasonality. The current market sentiment comes next.
As we delve deeper into the seasonality of the Nasdaq, we find that there are months that generate solid returns on average and months that do not. July is among the strongest months, while August is weak month and September is the weakest month on average. It also correlates with the very first chart of annual returns in the Nasdaq, which indicates that August and September are characterized by negative return pressures. In my view, it’s time to rebalance TQQQ and take profits, as the index has been so incredibly strong and the upcoming months are expected to be statistically weak.
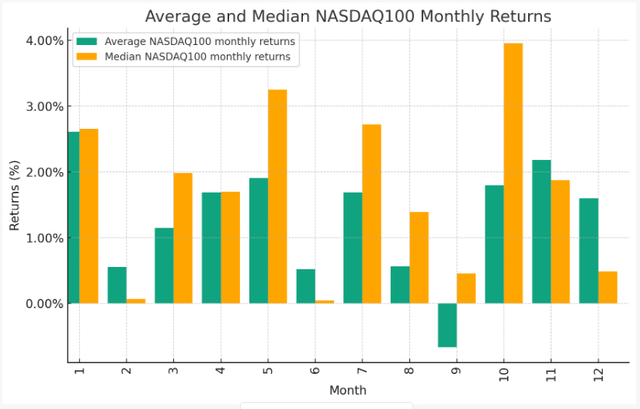
Average and Median Nasdaq100 Monthly Returns (Author, calculation via ChatGPT)
The greed at the top
Regarding short-term market sentiment indicators, the CNN Fear and Greed index has a strong correlation with QQQ and Nasdaq 100´s swing tops and bottoms. The current level of the index is near 78, which is indicative of “extreme greed” according to the chart. When such or similar levels are reached in the medium term, the risk significantly outweighs the return. Currently, I believe that this rally is also influenced by the great AI mania, which is influenced by a significant increase in the expectations of the TOP 10 companies in the QQQ to spend cash more efficiently and reveal new revenue streams with higher margins and EPS. The CNN Fear and Greed Index and Nasdaq 100 are compared using a model created via @macromicro.
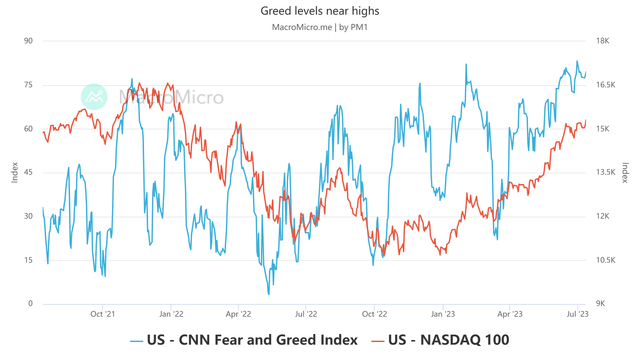
CNN Fear and Greed Index and Nasdaq (Author vai MacroMicro.me)
For TQQQ, such high levels of greed sentiment serve as a caution. Since the price is highly leveraged, active management is the superior strategy. In the case of QQQ, it is not a major issue, even in the long run.
Except CNN index, I believe it is beneficial to monitor the percentage of Nasdaq 100 stocks that are above their 50-day moving average. The current value of 87 is close to a multi-year high. Where there is also some room from this perspective, I believe this further demonstrates the to be cautious and even considering to think contrary.
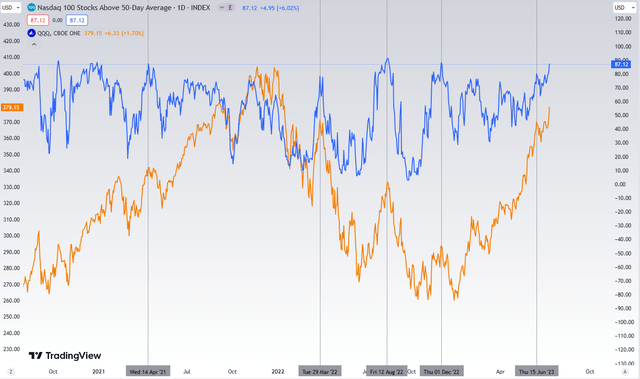
Nadaq 100 Stocks Above 50-day Average and QQQ (Author via Tradingview.)
Summary and Risks
While the bullish rally in the technology sector is enormous, it is primarily driven by the upward revision of EPS, but also by the hope of artificial intelligence, which could bring greater efficiency and margin improvements to large companies, which have the largest weight in QQQ. There is also the possibility that disinflation will cause the stock to rise and the trend to persist. However, as stated in the analysis, there are a number of factors that, based on historical trends, speak to greater risk than reward. Due to TQQQ’s leverage and the current market environment, I believe it is best to avoid the stock and sell long positions.
As stated, stocks (in the Nasdaq) tend to rise unexpectedly after 10-15 months of tightening. In the first 10 to 15 months of a tightening cycle, the stock price declined in the majority of cases (not always). The 2022-2023 period is not an exception; it simply confirms that after a period of aggressiveness, a recovery rally occurs.
In the case of monetary easing, sentiment is a bit more mixed, but stocks dislike aggressive monetary easing because the cycle is typically associated with recession or policy error. Except for the cycle from 1995 to 1998, every cycle in the dataset is associated with downward price pressures in the first ten months following the initiation of monetary easing. Currently, I anticipate that interest rates will reach their apex; there may be one or two 25bps hikes, but that should be it. Therefore, it is evident from our research that expected returns depend on the monetary cycle. Remember that this was the past and that returns are primarily influenced by forward EPS and real yields development.
This is another reason why it may be different this time. The problem with real yields is not as simple. The issue is more complex. However, if the Fed reaches or falls slightly short of its projected FFR goals, real yields will only decline marginally. If they continue to be flat for an extended period of time, the effect on EPS could be significant. If the decline in real yields is viewed as a successful accomplishment of monetary policy without a negative effect on earnings per share, the rally will probably continue. But that’s million-dollar question.
Second, based on seasonality, August and September are the weakest and weakest months of the year. With TQQQ up 142% and QQQ up 40% year-to-date in 2023, it is time to concentrate on the subsequent development. Similar patterns in the past are associated with mixed year-end performance, but from July to December there are drawdowns of 10 to 15% that can be partially ignored by QQQ but have a significant impact on TQQQ as a leveraged QQQ. Due to such stretched returns in 2023 YTD, I believe the future risk-to-reward ratio is unfavorable on the long side, and I prefer to stay out, primarily of TQQQ, to avoid potential drawdowns of greater magnitude. While the past is in no way a guarantee of future returns, it is useful to examine similar patterns for insights. Yes, every cycle is unique, and it is important to remember this. Throughout history, the economy, financial market, and monetary policy have undergone profound transformations. However, history often repeats itself.
Thirdly, investigating the very short-term overbought indicator such as the CNN Fear and Greed Index, which indicates that greed levels are nearing their long-term peak. It has always been an indicator of short-term price movement. It also correlates with a different indicator measuring the number of Nasdaq stocks or shares that are above the 50-day moving average, which is slightly below the highs. The market rally could continue. However, there are statistical and sentimental risks in the short- and medium-term, let’s say for the next three months, that warrant caution.
Additional risks related to leveraged ETF
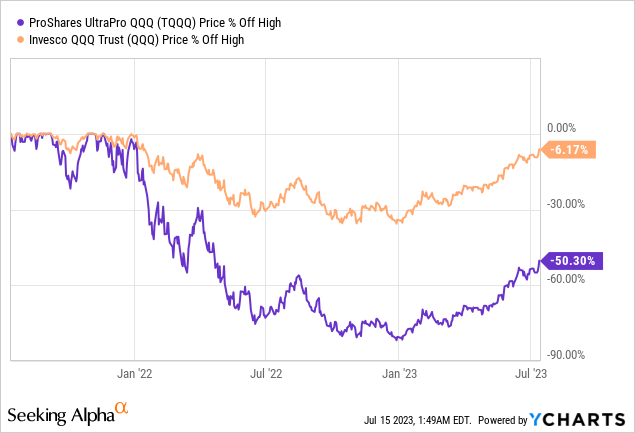
The primary objective of leveraged ETFs, such as TQQQ, is to track and deliver three times the daily performance of the Nasdaq 100 index. From this point forward, numerous risks emerge. It does not imply triple Nasdaq 100 returns over a longer time period. It means that when the Nasdaq loses -2% in a day, TQQQ should track -6% and vice versa. However, if QQQ experiences a series of positive and negative returns, it can have a significant impact on the ETF. I believe the strongest confirmation exists when comparing the index highs of QQQ and TQQQ and their respective drawdowns. The recovery phase is weaker than that of QQQ. I had provided an illustration for understanding. While QQQ is down only -6% from its high, TQQQ is down more than -50%. Therefore, the assumption that it should be “triple” of QQQ or Nasdaq 100 must be avoided.
TQQQ is a highly risky and speculative asset that requires active and short-term management. The key outcome of the thesis is rebalancing QQQ and selling TQQQ due to a higher probability of drawdown (after such a strong rally), which could harm even professional investors. Leveraged exchange-traded funds are not suitable for long-term investment, but rather for speculative or tactical positioning. From a stock-picking perspective, I believe that there are opportunities in the technologies sector or in the banking industry based on a stringent combination of risk profile, adjusted valuation, and earnings. Additionally, there are some companies which, in my opinion, should be avoided due to limited margin of safety.
Remember that this is not investment advice, and each investor should conduct their own research. The analysis merely reflects my current thoughts and perspective; nowhere is it stated that I will be correct.
Read the full article here