By Zhaoyi Yang, FRM, and Sandrine Soubeyran, Global Investment Research, FTSE Russell
Foreign investors have shied away from Chinese bonds since 2022. Why, and was it wise?
Foreign investments in all categories of Chinese bonds via direct investment in the China Interbank Bond Market, or CIBM Direct, have fallen to 2.3 trillion yuan in April 2023, from a peak of 2.8 trillion in January 2022[1] as shown in Chart 1. A similar declining trend can be observed via the Bond Connect northbound trading[2], which offers a separate channel for international institutional investors to access the Chinese bond market via Hong Kong.
FTSE Russell, ChinaBond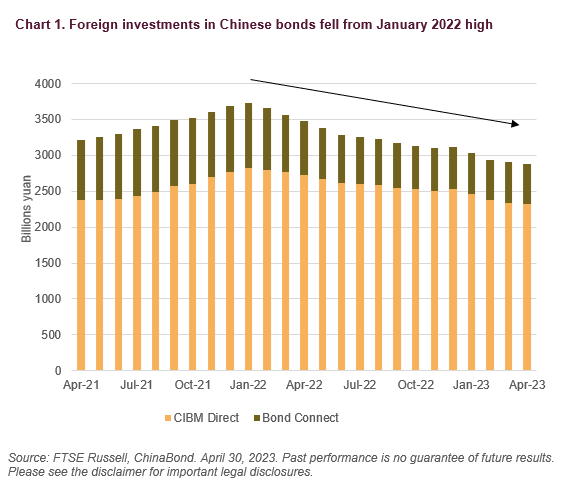
Even Chinese government bonds, one of the most liquid and popular instruments with foreign investors, have registered capital outflows. Since February 2022, foreign participation has fallen to pre-Covid levels, below 10% (Chart 2). An important reason behind this declining interest has been the smaller yield premium of Chinese bonds compared to G7 bond markets (Chinese yield spreads over G7 fell sharply and have stayed negative).
Unlike other major economies, the Chinese economy did not rebound in 2022 after remaining in Covid lockdowns. Low inflation meant that China could avoid monetary tightening, unlike the G7 economies, which implemented aggressive policy tightening to control inflation. Commensurate with diverging monetary policies was the weaker Chinese yuan relative to the US dollar, which was another factor for capital outflows.
FTSE Russell, ChinaBond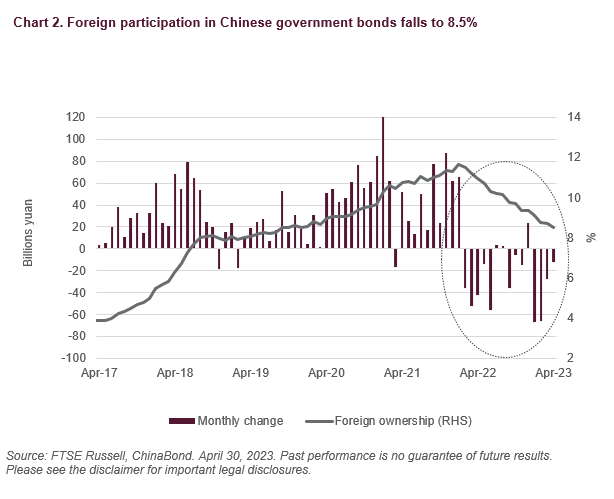
Missed opportunity for foreign investors in 2022?
Despite reduced foreign participation, Chinese government bonds have shown resilience and outperformed most of their global peers. Chart 3a shows Chinese government bonds topped the list for positive returns in local currency terms in 2022, and made the smallest losses in US dollar terms, only lagging short US Treasuries.
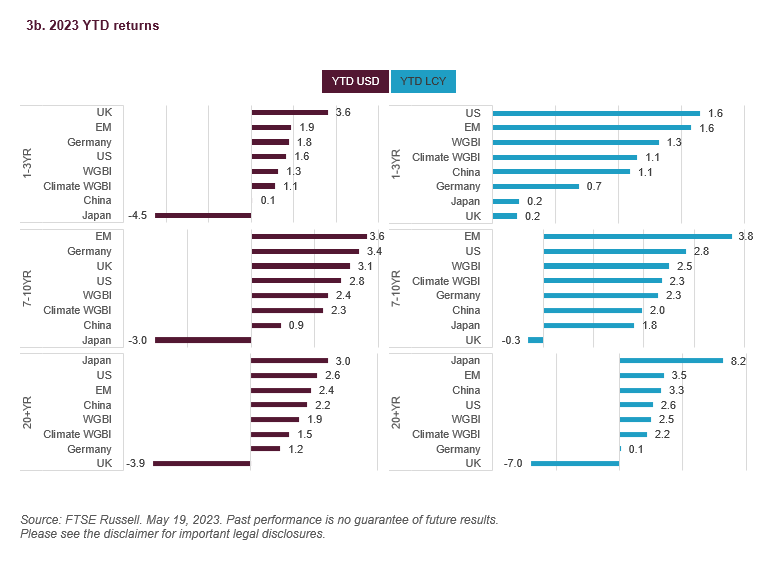
More recently, the performance since January (Chart 3b) suggests that Chinese government bonds have continued to benefit from an easing in monetary policy (e.g., liquidity support from the PBoC via the reverse repos and medium-term loan facilities, and the cut in reserve requirement ratio), delivering positive returns in both local currency and US dollar terms. With Chinese inflation at less than 1% y/y, the PBoC is expected to maintain its dovish policy stance for some time, and the environment could be ripe for renewed foreign investor participation. The ongoing US debt ceiling crisis, the risk of a surge in US Treasury Bill issuance should a debt ceiling deal be reached, and Fed concerns about US core inflation all argue against an early Fed policy pivot to cut rates. In addition, the Chinese government bond market has a low correlation with G7 government bonds and attractions as a fixed-income portfolio diversifier as a result.
FTSE Russell FTSE Russell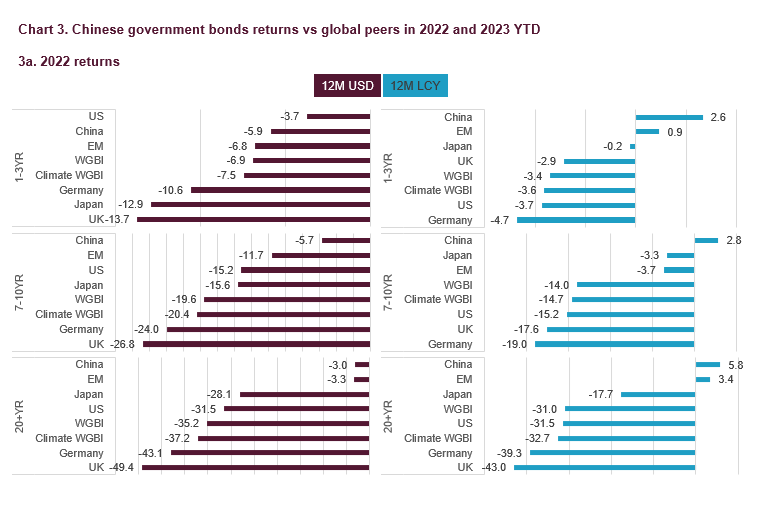
After a brutal 2022, a sweet spot for Chinese US dollar high-yield bonds?
The move away from Chinese onshore bonds by overseas investors was also evident in the offshore dollar high-yield bond market, where performance was hit by defaults of property developers during 2022, and a loss of confidence in the sector. As a result, Chinese high-yield dollar credits lost almost 30% in 2022, despite a strong comeback in Q4, helped by the 16-point relief package for the property sector. In addition to a loss of confidence as property bond issuers continued to restructure their debt, US dollar bond investors also feared borrowers would opt to pay back their onshore RMB-denominated debt before their US dollar debt, increasing uncertainty over dollar bond repayments.
Consequently, Chinese $ high yield bond spreads significantly widened between October through early November 2022 (Chart 4). Since then, they have eased and narrowed by about 4400bps from the peak in Q4 2022, after the combination of relief measures and the country’s easing of Covid restrictions prompted a strong rally. More recently, spreads have widened to 5500bp on renewed risk aversion and are higher than pre-Covid levels.
FTSE Russell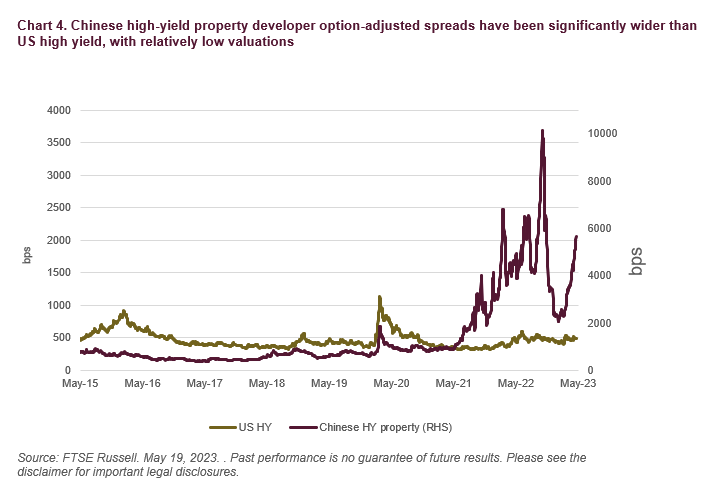
But wider credit spreads, implying lower bond valuations currently, may suggest higher future investment returns, with low bond prices strongly correlated with higher future returns for risky assets like high-yield bonds, as discussed in our Valuation Matters paper[3].
Facts and fiction about the Chinese corporate debt markets onshore and offshore
A careful look at the broader Chinese corporate bond market shows that bonds issued by property developers account for just 2.1% of the overall domestic corporate bond market and 6.8% of the US dollar corporate bond market. The higher property weighting in the US dollar corporates is mainly driven by the sector’s significant share of the overall high yield $ market (almost 37% in high yield vs 4% in investment grade). But it’s worth noting that high-yield rated bonds (market value of $21.8 billion) account for around 7% of the entire Chinese US dollar corporate universe (market value of $298.4 billion).
FTSE Russell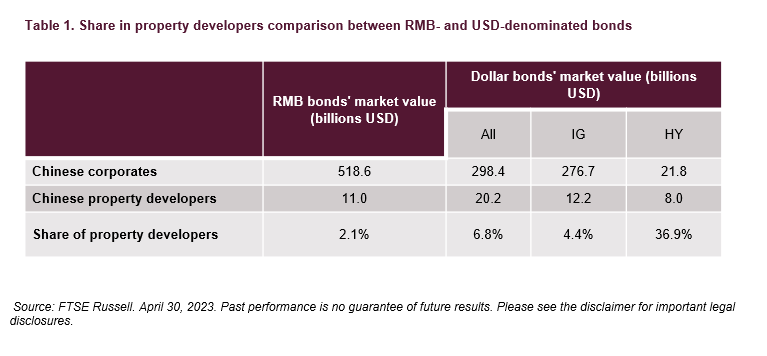
So, several factors may cause a recovery in foreign participation in the Chinese onshore bond market. These include low inflation, supportive monetary policies, low correlation with G7 bond markets, regulatory reform by the Chinese government in opening its financial markets to overseas investors, and an improving economic outlook for the property sector. Although earnings and fundamentals dominate the property bond market in the long run, some further regulatory support for the property sector could help the market in the near term.
[1] Source: China Bond Information Network – Monthly Bulletin of Statistics. Foreign institutional investors can trade in the CIBM via three channels, 1) CIBM Direct, accounting for the largest share in the bond custodian, 2) Bond Connect northbound trading, and 3) Qualified Foreign Institutional Investor (QFII) and RMB Qualified Foreign Institutional Investor (RQFII).
[2] Company Introduction | Bond Connect (chinabondconnect.com).
[3] Valuation matters: US high yield and US equities | FTSE Russell.
© 2023 London Stock Exchange Group plc and its applicable group undertakings (the “LSE Group”). The LSE Group includes (1) FTSE International Limited (“FTSE”), (2) Frank Russell Company (“Russell”), (3) FTSE Global Debt Capital Markets Inc. and FTSE Global Debt Capital Markets Limited (together, “FTSE Canada”), (4) FTSE Fixed Income Europe Limited (“FTSE FI Europe”), (5) FTSE Fixed Income LLC (“FTSE FI”), (6) The Yield Book Inc (“YB”) and (7) Beyond Ratings S.A.S. (“BR”). All rights reserved.
FTSE Russell® is a trading name of FTSE, Russell, FTSE Canada, FTSE FI, FTSE FI Europe, YB and BR. “FTSE®”, “Russell®”, “FTSE Russell®”, “FTSE4Good®”, “ICB®”, “The Yield Book®”, “Beyond Ratings®” and all other trademarks and service marks used herein (whether registered or unregistered) are trademarks and/or service marks owned or licensed by the applicable member of the LSE Group or their respective licensors and are owned, or used under licence, by FTSE, Russell, FTSE Canada, FTSE FI, FTSE FI Europe, YB or BR. FTSE International Limited is authorised and regulated by the Financial Conduct Authority as a benchmark administrator.
All information is provided for information purposes only. All information and data contained in this publication is obtained by the LSE Group, from sources believed by it to be accurate and reliable. Because of the possibility of human and mechanical error as well as other factors, however, such information and data is provided “as is” without warranty of any kind. No member of the LSE Group nor their respective directors, officers, employees, partners or licensors make any claim, prediction, warranty or representation whatsoever, expressly or impliedly, either as to the accuracy, timeliness, completeness, merchantability of any information or of results to be obtained from the use of FTSE Russell products, including but not limited to indexes, data and analytics, or the fitness or suitability of the FTSE Russell products for any particular purpose to which they might be put. Any representation of historical data accessible through FTSE Russell products is provided for information purposes only and is not a reliable indicator of future performance.
No responsibility or liability can be accepted by any member of the LSE Group nor their respective directors, officers, employees, partners or licensors for (A) any loss or damage in whole or in part caused by, resulting from, or relating to any error (negligent or otherwise) or other circumstance involved in procuring, collecting, compiling, interpreting, analysing, editing, transcribing, transmitting, communicating or delivering any such information or data or from use of this document or links to this document or (B) any direct, indirect, special, consequential or incidental damages whatsoever, even if any member of the LSE Group is advised in advance of the possibility of such damages, resulting from the use of, or inability to use, such information.
No member of the LSE Group nor their respective directors, officers, employees, partners, or licensors provide investment advice and nothing in this document should be taken as constituting financial or investment advice. No member of the LSE Group nor their respective directors, officers, employees, partners, or licensors make any representation regarding the advisability of investing in any asset or whether such investment creates any legal or compliance risks for the investor. A decision to invest in any such asset should not be made in reliance on any information herein. Indexes cannot be invested in directly. Inclusion of an asset in an index is not a recommendation to buy, sell or hold that asset nor confirmation that any particular investor may lawfully buy, sell or hold the asset or an index containing the asset. The general information contained in this publication should not be acted upon without obtaining specific legal, tax, and investment advice from a licensed professional.
Past performance is no guarantee of future results. Charts and graphs are provided for illustrative purposes only. Index returns shown may not represent the results of the actual trading of investable assets. Certain returns shown may reflect back-tested performance. All performance presented prior to the index inception date is back-tested performance. Back-tested performance is not actual performance but is hypothetical. The back-test calculations are based on the same methodology that was in effect when the index was officially launched. However, back-tested data may reflect the application of the index methodology with the benefit of hindsight, and the historic calculations of an index may change from month to month based on revisions to the underlying economic data used in the calculation of the index.
This document may contain forward-looking assessments. These are based upon a number of assumptions concerning future conditions that ultimately may prove to be inaccurate. Such forward-looking assessments are subject to risks and uncertainties and may be affected by various factors that may cause actual results to differ materially. No member of the LSE Group nor their licensors assume any duty to and do not undertake to update forward-looking assessments.
No part of this information may be reproduced, stored in a retrieval system or transmitted in any form or by any means, electronic, mechanical, photocopying, recording or otherwise, without prior written permission of the applicable member of the LSE Group. Use and distribution of the LSE Group data requires a licence from FTSE, Russell, FTSE Canada, FTSE FI, FTSE FI Europe, YB, BR and/or their respective licensors.
Original Post
Editor’s Note: The summary bullets for this article were chosen by Seeking Alpha editors.
Read the full article here


