By Brian Nelson, CFA
Stock prices are based in part on the two primary cash-based sources of intrinsic value – net cash on the balance sheet and future expected enterprise free cash flow. Stock returns are based on changes in expectations of these future expected enterprise free cash flows. If expectations of a company’s future enterprise free cash flows increase, the stock price should increase and so should returns. If expectations of a company’s future enterprise free cash flows decrease, the stock price should fall and so should returns. Changes in expectations are the primary driver behind movements in the stock market.
With that said, quantitative research has fallen into the trap of thinking that one can expect future performance to be driven by past results that largely ignore expectations. Let me explain. Most of the quantitative studies that incorporate fundamental data use realized, actual data that has little regard to the influence that future expectations have on prices. Today’s earnings may have little to do with what earnings may look like 5-10 years from now, but today’s prices certainly will consider the outlook of the firm. We therefore can’t really determine whether a stock with a low P/E, for example, is undervalued or overvalued just by looking at the P/E ratio alone.
The balance sheet matters, too. A company could simply have a huge net debt position as to why its P/E ratio is so low – the low P/E doesn’t necessarily mean shares are undervalued. We wrote an article on AT&T (T) more recently that explained why the P/E ratio can be artificially depressed. AT&T has dwindling growth prospects and deteriorating free cash flow. It also has a massive net debt position and now potential contingent liabilities associated with lead cables. However, its accounting earnings may hold up despite the challenges, but weakened expectations of future free cash flow impacts enterprise valuation, and the firm’s huge net debt position is a reduction to enterprise value in arriving at its equity value (its share price). In AT&T’s case, these dynamics combine to result in a depressed equity value (price) despite accounting earnings; hence, the low P/E ratio on a fairly valued or potentially overvalued stock.
If stock prices and returns are based on future expectations and changes in them, then how can using realized, actual data explain stock prices and returns? Therein rests the paradox. It can’t. When we released the first edition of our book Value Trap in December 2018, we explained that “value” investors weren’t using the “right” data, as in that they should be using expected data (not realized, actual), and second, weren’t using the right framework in measuring “value,” as in the discounted cash-flow model (i.e. enterprise valuation), which considers the balance sheet as well as expectations of future free cash flow.
Most measures of “value” within quantitative models default to the application of multiple analysis – as in the price-to-earnings (P/E) ratio or price-to-book (P/B) ratio. However, a company with a high P/E ratio could be undervalued if it has a huge net cash position, generates gobs of free cash flow and has tremendous growth prospects, while a company with a low P/E ratio with the opposite characteristics could be overvalued. In quant analysis, how can one measure “value” by completely ignoring the balance sheet by assessing just the earnings [E] in the P/E ratio – and if one uses the price-to-book (P/B) ratio, one ignores the very idea that many companies are asset-light these days and some even have negative book values. Even the EV/EBITDA multiple has shortcomings because it ignores the longer-duration of investing, where this year’s EBITDA may look nothing like next year’s.
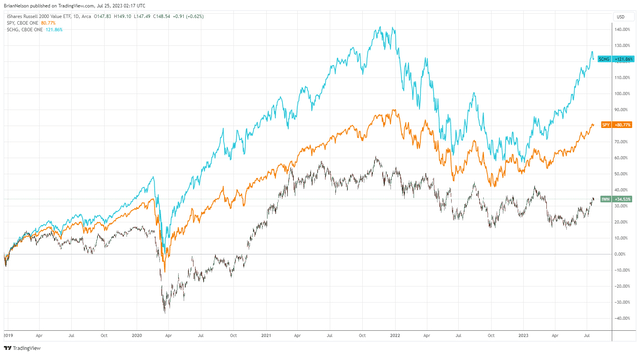
So how should one think about all of this? Well, within quantitative applications, if the right data isn’t being used and valuation multiples have considerable shortcomings, one might expect the application of quantitative “value” investing to be nothing short of random. We think it is. There’s no reason why low P/B stocks or low P/E stocks should do better than high P/B stocks or high P/E stocks. Many may point to reversion-to-the-mean tendencies, but this dynamic could as easily be a function of earnings advancing or contracting than any particular price moves. What we do know, however, is that the stylistic area of large cap growth has significantly outperformed the stylistic area of small cap value since the release of the first edition of Value Trap – and we don’t view this dynamic as random at all.
Large cap growth has trounced the market and small cap value since the release of the first edition of Value Trap in December 2018. (Trading View)
Large cap growth equities such as Apple (AAPL), Microsoft (MSFT), and Alphabet (GOOG) (GOOGL) are overflowing with robust cash-based sources of intrinsic value – net cash on the balance sheet and future expected enterprise free cash flows. These names are rather straightforward to like, too, and have asymmetric risk-reward dynamics, as their net cash positions generally preclude bankruptcy risk, leaving a probability distribution of fair values skewed significantly to the upside, but that is not the only reason. Because their operations have tremendous growth prospects, it leaves open the tendency for the market to build in ever-increasing expectations of their already-robust free cash flow. What that means is that these companies can continue to march ever higher even as they showcase premium valuation multiples.
We recently wrote an article that explains why we think markets are finally making sense again. The stylistic area of large cap growth, as measured by the Schwab U.S. Large-Cap Growth ETF (SCHG) is up nearly 40% so far in 2023, while small cap value, as measured by the iShares Russell 2000 Value ETF (IWN), has managed to eke out a 8% advance on the year. Not only is large cap growth significantly outperforming small cap value since the release of the first edition of Value Trap, but it is trouncing the market and dividend growth equities, too, as measured by the performance of dividend aristocrats in the SPDR S&P Dividend ETF (SDY), which is basically flat on the year. When we’re talking about companies such as Apple, which we love, and Microsoft, another one of our favorites, it’s just hard not to like what the stylistic area of large cap growth brings to the table for long-term investors.
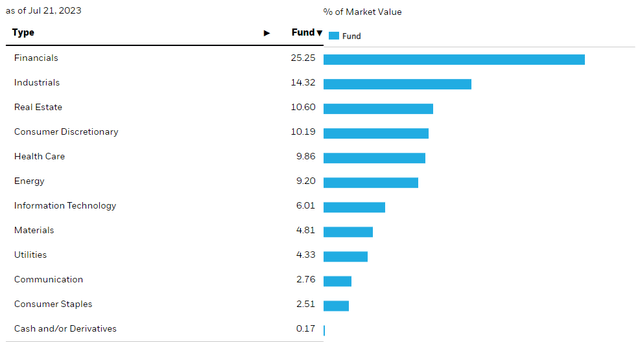
Small cap value is over-exposed to financials. (iShares Russell 2000 Value ETF)
On the other hand, we expect the stylistic area of small cap value to continue to suffer because it largely has the opposite cash-based dynamics. The iShares Russell 2000 Value ETF, for example, has a 25%+ weighting in financials (see image above), which tend to run leveraged business models, whereupon assessing their cash flow generation is somewhat arbitrary, to a very large degree. Expectations for many financials are that they may suffer from tighter regulations, too, as a result of the recent regional banking crisis and the SVB Financial (OTCPK:SIVBQ) catastrophe. We’re also not fans of the dividend payouts of banking entities at all. We doubt that a stylistic area with a quarter of its exposure tied to financials has the capacity to outperform an area with tremendous cash-based sources of intrinsic value and growth prospects such as the area of large cap growth. We think small cap value will remain cursed for a long time yet.
Read the full article here


