


It’s been several weeks since my last article and the S&P 500 (SPY) has continued higher as the technicals suggested it would. Disinflation has accelerated, yields are on the slide and the Fed could be about to make its last hike.
The situation sure looks bullish. So, should we just buy and hold over the quiet summer months and lounge by the pool?
That might not be such a terrible idea as long as we prepare for different scenarios. Where is our view wrong? Could there be better opportunities? What would make us take profits?
This article will prepare you for the sessions ahead using a variety of technical analysis techniques applied to the S&P 500 in multiple timeframes. The aim is to provide an actionable guide with directional bias, important levels, and expectations for price action. The evidence will then be compiled and used to make a call for the week(s) ahead.
S&P 500 Monthly
The July bar has now made a higher high above the ‘weak’ June top of 4458. This has satisfied the bullish bias, but also means a reversal pattern can now develop. Even so, the July bar looks unlikely to reverse and form anything too bearish in the six sessions left this month. Assuming it closes above 4458, the August bar should follow through and at least make higher highs.
SPX Monthly (TradingView)
The July peak of 4578 came near to the potential resistance at the February and April 2022 monthly highs of 4593-4595.
4385 is potential support at the July low, with 4325 a level of interest below. 4195-200 is then the next major support area.
An upside Demark exhaustion count is on bar 7 (of 9) in July. We can expect a reaction on either bar 8 or 9 should new highs be made (compared to the other bars in the count) so the timing window is wide. This can be fine-tuned in the smaller timeframes and by monitoring the monthly chart for signs of reversal. Once the exhaustion is complete, it should lead to a large pause/correction that is clear on the monthly chart.
S&P 500 Weekly
This week’s candle was neutral to bullish – higher highs, higher lows and a higher close were all a positive. However, the small weekly range and failure to hold above the channel are small red flags and a reversal lower could develop should next week’s candle follow through below 4504.
The Demark count has now finally registered bar 9 indicating weekly exhaustion. Needless to say, this is just another tool and not a magic signal to short. It could lead to correctional action and a dip / pause over the coming weeks as the exhaustion is reset. I don’t expect it will lead to a top, but inflection points such as 4325-28 will be important in signaling whether any downside reaction is part of bullish consolidation or the start of a larger reversal.
SPX Weekly (TradingView)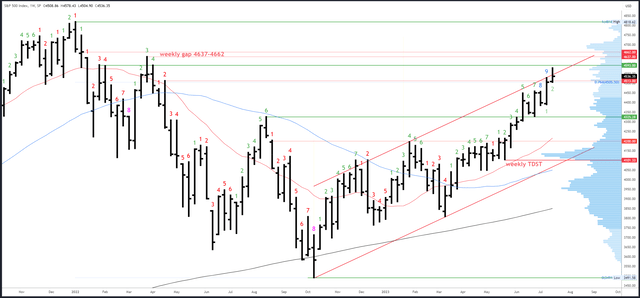
4593-95 is potential resistance from the monthly chart and there is a weekly gap from 4637-62 which could fill later in August.
4504 is near-term support, then the break-out area of 4448-58, followed by 4385-89.
As mentioned earlier, an upside (Demark) exhaustion count has completed on bar 9 (of 9).
S&P 500 Daily
The daily chart has a trend channel intersecting the red weekly channel at nearly the same point and this is where the rally stalled this week. Wednesday’s action was interesting as it gapped above both channels, threatening to break-out, before stalling, forming a doji and dropping back again on Thursday. This has formed a short-term reversal pattern which could develop further should 4504 break.
SPX Daily (TradingView)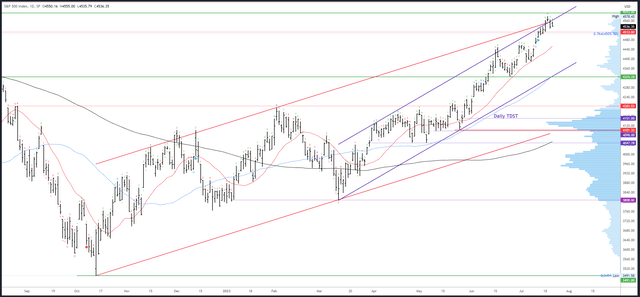
Resistance is 4578, then the aforementioned monthly/weekly references just above.
Potential support is at 4504 and 4448-58. The 20dma is also important and could come into play next week. It will be at 4460 on Monday and rising 8 points per session. The first test should hold, but I think it is due for a break should it be tested again as price has stayed above for over two months now.
Events Next Week
A busy week is in store. The FOMC meeting on Wednesday is the main event, but with the odds of a hike at 99.8%, the focus will be on any signals for September (99.2% in favor of a hold) and beyond.
Data highlights include PMIs on Monday, advance GDP plus claims on Thursday, and the Core PCE Price Index on Friday.
Now that inflation has seemingly been tamed, the Fed may soften its stance. However, the long-awaited recession looks to be getting closer and rising claims will be a key indicator.
Probable Moves Next Week(s)
I still don’t think the S&P500 has topped, and the 4600s should be reached later in August, with the 4637-62 weekly gap now the next major target as monthly exhaustion completes.
However, the weekly exhaustion and daily reversal pattern at the top of the channels suggest a pullback should develop in the near-term. This should be confirmed by a break of 4504 and/or a break of the 20dma.
4448-58 is the first interesting area of support (plus 4453 is the 23% Fib common for a pullback in this phase of the trend). Should price reach there, it would be the largest pullback since early May, and could set up the next rally in the uptrend.
While I don’t expect the S&P500 to trade much below 4448, I do always prepare for alternative scenarios. A deeper pullback to 4375-85 is possible and another opportunity to try longs. I will remain bullish as long as price stays above 4325-28.
Read the full article here