

My readers all likely know by now the basic macroeconomics of bonds, inflation, GDP, unemployment, and interest rates. In light of changes in these indicators, among others, I revisit ProShares UltraShort 20+ Year Treasury ETF (NYSEARCA:TBT), which I covered previously in July 2022 in my article, “TBT: A Textbook Macro Trade For Difficult Times.” For those who need a reminder, TBT is a high duration ETF highly sensitive to market interest rates. It trades derivatives to achieve -2x the daily movement in the ICE U.S. Treasury 20+ Year Bond Index. Per my analysis of the aforementioned data, there is no longer clarity that the Federal Reserve will continue to increases the Federal Funds Rate, and therefore the risks to holding this ETF outweigh potential rewards. For full disclosure, I closed my trade around October highs on the basis of technical indicators suggesting TBT was overbought and the bond market oversold. For those who haven’t already sold, and bought around the time I recommend it, I suggest taking profits that still beat the S&P 500 return by a few points.
The Dot Plot
In its quarterly released Summary of Economic Predictions, The Federal Reserve releases a chart that plots where Federal Open Market Committee, FOMC, voters believe the appropriate monetary policy, or Federal Funds Rate, should be for a given timeframe. While we anticipate the Q2 release, we can analyze the Q1 release, shown below.
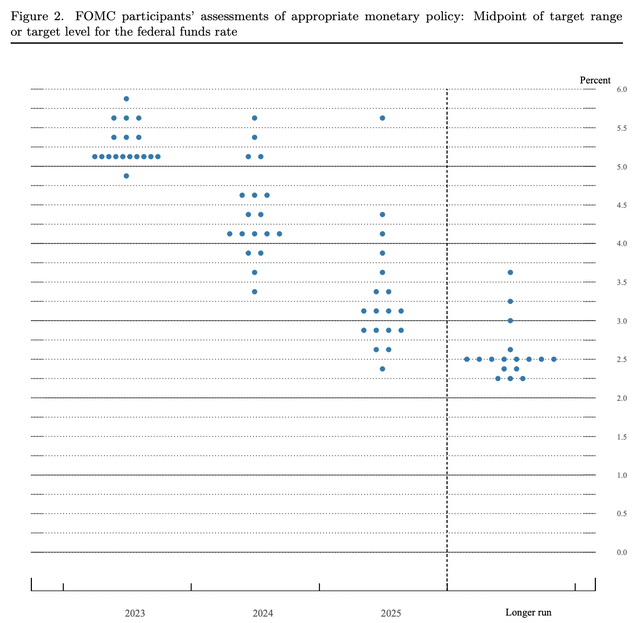
Board of Governors
The current Federal Funds rate sits between 5% and 5.25%. Looking at the chart above, we can see that a majority of 10 members don’t believe any further rate hikes are necessary in 2023. One member believes that a rate cut is necessary, and seven members believe that further rate hikes are necessary. Looking forward to 2024, just one member believes that a rate hike is needed, two members believe the rate should stay at its current rate, and a majority believes that the rate should be cut below 4.75%. Jumping forward to 2025, you can see that a majority believes the Federal Funds rate should be below 3.25%, and for the longer run, most see the rate around 2.5%. Based on these majorities and ignoring outliers, it thus seems that the decision makers as a whole have become dovish in the near term as well as the long term, likely to lower the Federal Funds Rate.
Macroeconomic Indicators
I now turn the macroeconomic indicators, economists, and decision makers track in forming their point of view. I review inflation and unemployment, trends in the natural rate of unemployment, the stock market, and credit spreads.
Inflation and Unemployment
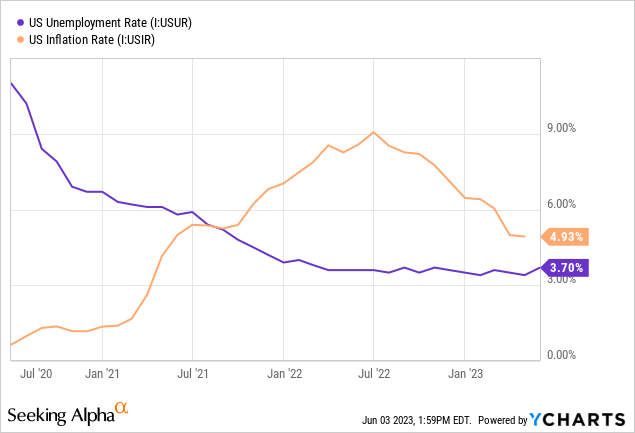
The chart below shows unemployment and inflation. Inflation reached its peak in July 2022 and has since fallen quite steadily to 4.93%. It seems as though prior interest rate hikes are taking effect, and it is important to consider that rate hikes take time to transmit into the economy. Meanwhile, unemployment has been relatively flat around 3.7%, which represents a notable uptick from the prior report. Investors will be on the lookout for further upticks in unemployment as affirmation of the decision-makers dovish point of view.
Non-Cyclical Rate of Unemployment
You may wonder how much unemployment is necessary to lower inflation to its long run target? Economists generally believe that some unemployment is necessary, as the macro economy transitions its employment concentrations from certain industries to others, and workers transition from job to job within industries. This may also be considered a rate of unemployment at which inflation does not accelerate, as it did for many months in recent years. The challenge of the Federal reserve during the pandemic was above natural unemployment rates with high inflation, to which it reacted dovishly. The latter point speaks to its bias in decision making. The chart below shows the long run trend in the natural rate of unemployment.
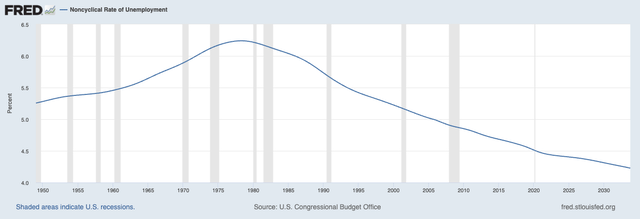
U.S. Congressional Budget Office
As technology improves and job matching happens faster, it is expected that unemployment remains relatively low. Decision makers may thus not require unemployment to increase much more from its current level of 3.7% as 2023 rates are around 4.4% and longer run rates closer to 4.2%. Prices are able to decelerate at an unemployment rate lower than natural, suggesting not much more unemployment is needed to fix the inflation problem. Furthermore, like with inflation, there is a lag time in the transmission of monetary policy’s impact on unemployment. It is therefore quite possible that the prior rate hikes will take us to the natural rate of unemployment.
Stock Market
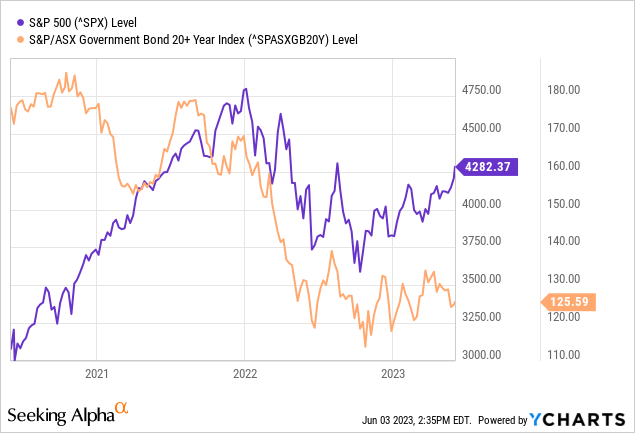
The stock market may be considered a leading indicator for bond prices. Investors favoring higher risk in the form of equities are more likely to act first in times of uncertainty. The chart below shows the rally in stock prices ahead of what I anticipate to be a rally in bond prices. While there is a high degree of correlation, bond prices haven’t yet rallied with stocks in 2023.
Credit Spreads
I look at the spread between the risk free Federal Funds Rate and a typical consumer rate in 30-year mortgages. Again, there is a high degree of correlation between the two numbers. However, recently mortgage rates have risen to highs of 6.79%. The rising cost of housing is thus something the Federal Reserve can paradoxically address by lowering rates to make mortgage payments more affordable. Of course, that would tend to have an effect on home prices and thus inflation, but the widening spread is still an indicator of contraction, which would spur interest rate cuts.

Valuation
Taking all this data in, I thus believe that TBT share prices are likely to depreciate in the near future. Time is not on the side of a fund that invests in derivatives, as time value in the assets is lost every trading day. TBT is an expensive fund, not meant to be held for long periods of time. Taking underlying index’s duration of approximately 19, multiplying by 2x leverage and anticipating the mode 2024 Federal Funds rate on the dot plot will realize, I calculate approximately a 1% decrease in interest rates in the next year, or 38% downside. This equates to a rough price target of $19 and of course is subject to change base of the daily compounding effect of rate changes and is only my best estimate.
Conclusions
TBT was a great trade when it was clear that interest rates were rising. The Federal Reserve appears more dovish and economic indicators suggest that unemployment is rising close to where it should be and inflation is falling. We need to wait for existing hikes to take hold on the economy. This is what I imagine the majority of decision makers are thinking. I reiterate that the trade should be closed out at prices much lower than my prior estimates, and apologize to my readers for any irrational exuberance in my prior article. It’s simply a very difficult ETF to evaluate. I do, however, anticipate a rise in bond and stock prices in the coming months and the lowering of yields. Prior dips in the stock market already reflect an impending mild recession or at least a lack of economic expansion. My portfolio advice is to focus on quality growth stocks at good valuations. For long ideas, please see my articles on (OPRA), (ANIP) (RMTI), (AKBA), and (TIO).
Read the full article here